There have been many discussions about how the per-square-foot (psf) prices of new launch condos have been trending upwards recently. No one knows how far up it’ll continue to rise, so you should count your blessings if you can find good-location condos below these psf pricing trendlines.
The next question would probably be, how did this happen (or why is this happening)? Or, indirectly, if you’re a current condo owner, will we see similar patterns with resale and sub-sale prices?
Based on 99.co Researcher data, we’ve put together several charts to figure this out.
99-year-lease condos
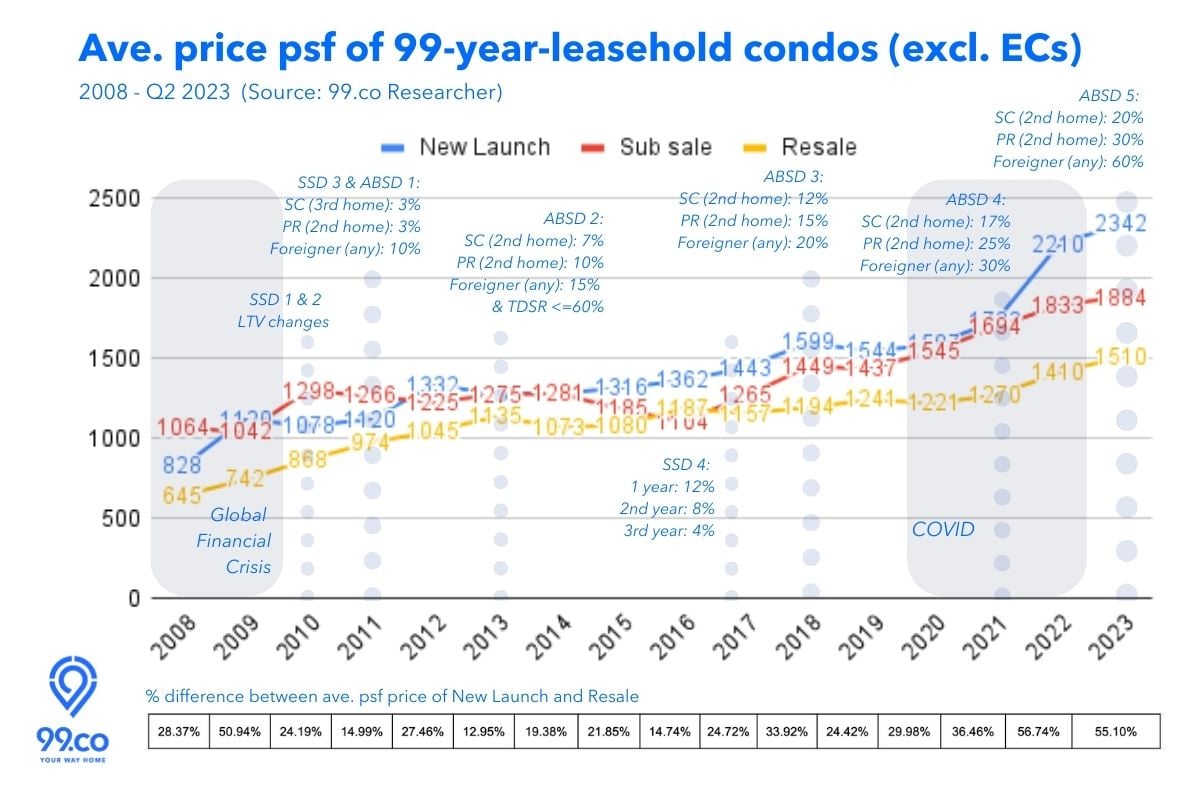
First, let’s look at 99-year leasehold condos. From 2008 to Q2 2023, all three average psf prices for New Launch, Sub Sale and Resale condos in this category have been trending upwards. Occasionally, you’ll get speculative selling, such as after the Global Financial Crisis of 2009, when sub-sale prices surpassed even average new launch prices in 2010 and 2011.
The government stepped in, introduced Seller’s Stamp Duty (SSD), and sub-sale prices never surpassed new launch prices ever since.
Fun fact: Since 2010, SSD taxes condo buyers who sell their recently purchased properties within the first 4 years. This rule was later relaxed to 3 years in 2017.
 But what about resale prices?
From 2008 till around 2016, the average psf price of resale condos has trended upwards more consistently than new launch prices. There were three occasions when the gap between the two went below 15%: 2011, 2013 and 2016.
The gap situation in 2011 was due to policies introduced, such as the change in loan-to-value (LTV) ratio in 2010, which saw borrowers able to only borrow up to 80% of their home value in loans (from 90%). This would have put more sell pressure on new launches, as buyers hunt for cheaper resale units, and speculation in the sub-sale market abated.
Similarly, the situation in 2013 – the closest resale prices have ever gotten near new-launch-price levels – was due to successive cooling measures. A buffet of curbs: new LTVs, Total Debt Servicing Ratio (TDSR), new ABSD rules impacting Singaporeans, PRs and foreigners, and the Executive Condo Mortgage Servicing Ratio (MSR), gave many home buyers, especially if they’re buying a brand-new condo, pause.
The annual average psf price of new launch condos suffered a dip from S$1,332 psf to about S$1,282 psf, while resale prices were up from S$1,045 psf the year before to an average high of S$1,135 psf.
But lo and behold, something changed in 2017.
Between 2017 and Q2 2023, average psf prices of new launch condos have increased by 62%, while average psf prices of resale condos increased by only half, at 31%. Sub-sale prices, on the other hand, went up by 49%.
So what could have caused average psf prices of new launch condos (or at least the demand for them) to rise dramatically after 2017?
Freehold condos
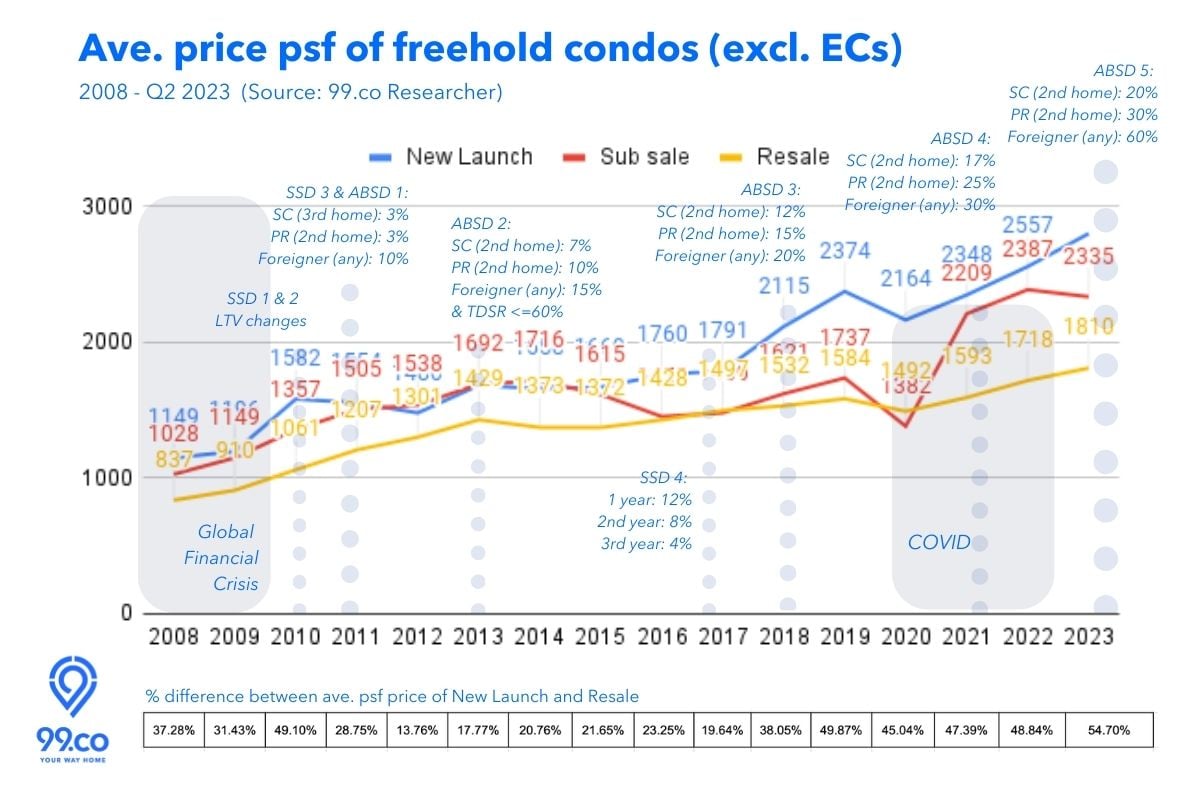
The answer lies in this chart, where we compare average psf prices of freehold condos.
The smallest gap between new launch and resale freehold condos was in 2012. After that, this gap stayed within the 20% range but widened dramatically after 2017.
In 2017, SSD rules were relaxed
In 2017, SSD rules were relaxed to help rejuvenate the property market. The tax for those who sold within the 1st year was reduced from 16% to 12%. Not only that, the window was reduced from 4 years to 3.
Hypothetically, this means a throwback to 2010-2011, where there will be more buying and selling of new launch properties, right?
Unfortunately no. Despite the relaxation of SSD, the average psf price growth of sub-sale freehold condos was tepid. Between 2017 and 2020 (before COVID), the growth was -7%.
However, in the same period, the sub-sale growth for 99-year leasehold condos was 22%. In other words, since the relaxation of SSD policies in 2017, speculators have gone into 99-year leasehold condos, driving up average psf prices for both new launch and sub-sale condos.
It’s not really about the sub-sale market
But here’s the thing: As per the chart below, the sub-sale market is relatively small compared to new launch and resale markets. It used to command annual figures of 2500-3800 units sold yearly. But since the introduction of SSD, it’s tempered down to about 300-500 units annually (except for the COVID year).
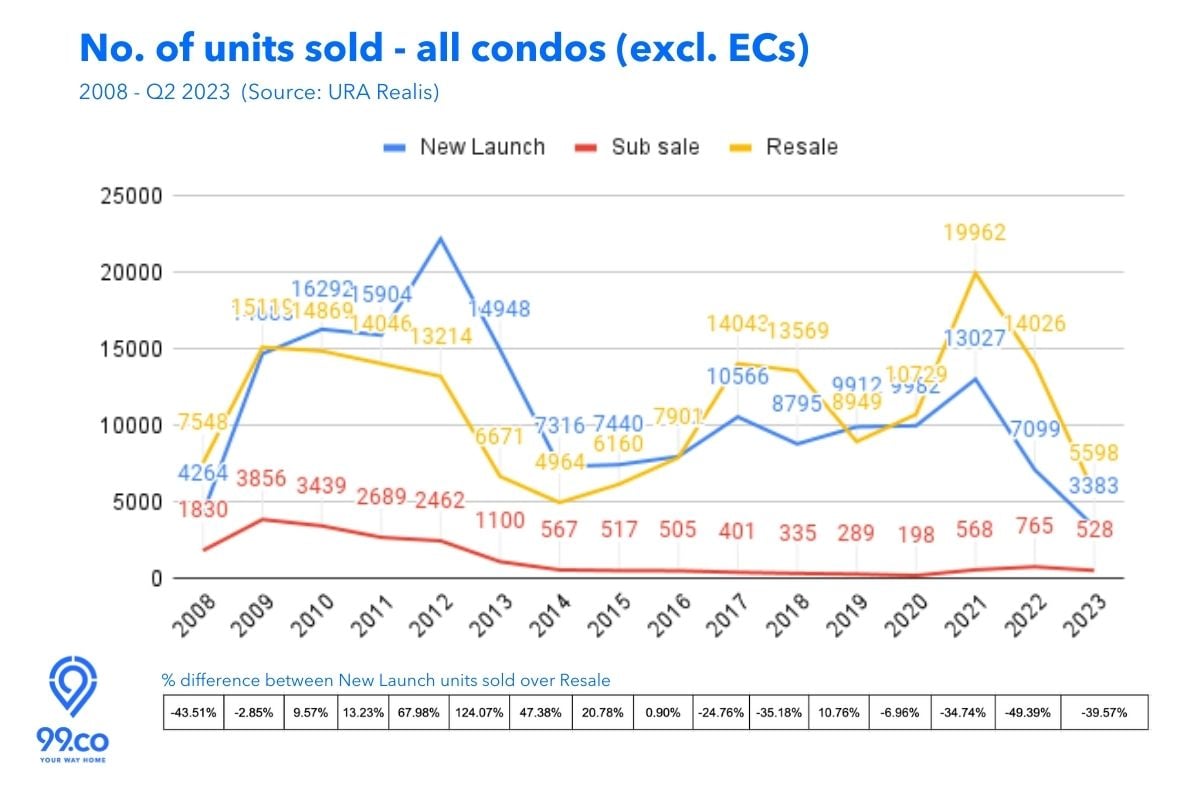
One interesting development is the volume change between new launches and resale condos. Before 2016, there were more new launch condos sold than resale. After 2016, more resale condos were sold than new launches (with one exception in 2019).
There are several factors why resale outstripped new launches post-2016.
From a policy perspective, a lower SSD and the introduction of another ABSD round in 2018, might have forced on-the-fence buyers, or upgraders, to quickly secure a home (or a 2nd home) before it’s too late.
Another major factor was the relaxation of the TDSR policy. In September 2016, the TDSR framework was relaxed for homeowners when they refinance their mortgages. In 2017, TDSR was further relaxed to allow homeowners to withdraw home equity loans without penalty to their TDSR.

Furthermore, the shorter SSD window (4 to 3 years) may have also prompted many sellers to market their fairly new homes without penalty.
A spillover effect from this is Developer ABSD, which penalises developers if they have unsold units after five years of buying the land. This meant developers had to finish their projects quicker, giving rise to more resale units in the market.
In short, with the relaxation of rules, there was an increased supply (and demand) for resale condos.
The switchover coincided with the phenomenal rise in average psf prices of new launches after that. As psf prices of resale condos even out on volume, average psf prices of new launch condos began to rise due to a relatively smaller supply.
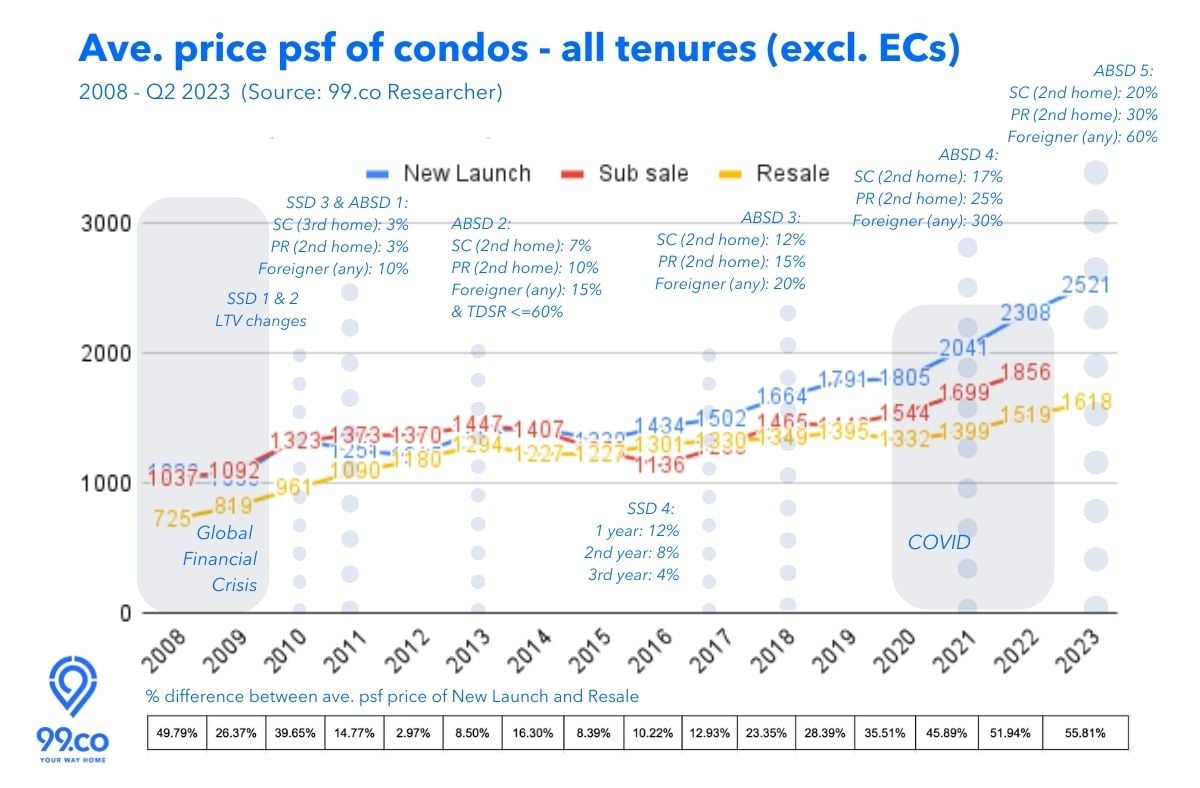
COVID changed the pricing game
Finally, the biggest pricing catalyst came when COVID happened. The global pandemic forced many work-from-homers to strike out and hunt for a place to call their own. However, due to border restrictions on goods and manpower, developers struggled to complete projects quickly enough. The supply glut drove prices up further.
Not to mention, BTO project delays and an overheating rental market exacerbated the bottleneck as hopeful homeowners shifted their interest towards new launch condos.
Furthermore, government land sales (GLS) and collective sales are becoming far more challenging for developers as bidding prices escalate for attractive and rare locations, and the spectre of developer ABSD remains.
As demand for land and construction costs increased, the average psf prices of new launch condos followed suit.
Just like how the end of the Global Financial Crisis overheated the sub-sale market, COVID has forever charged the new launch condo market.
Between 2020 and Q2 2023, the average psf price of new launch condos surged by 40%, compared to 24% for sub-sales and 21% for resale.
Region comparisons
Now that we know why average psf prices of new launch condos have spiked, here’s where the gap is highest among the three regions in Singapore.
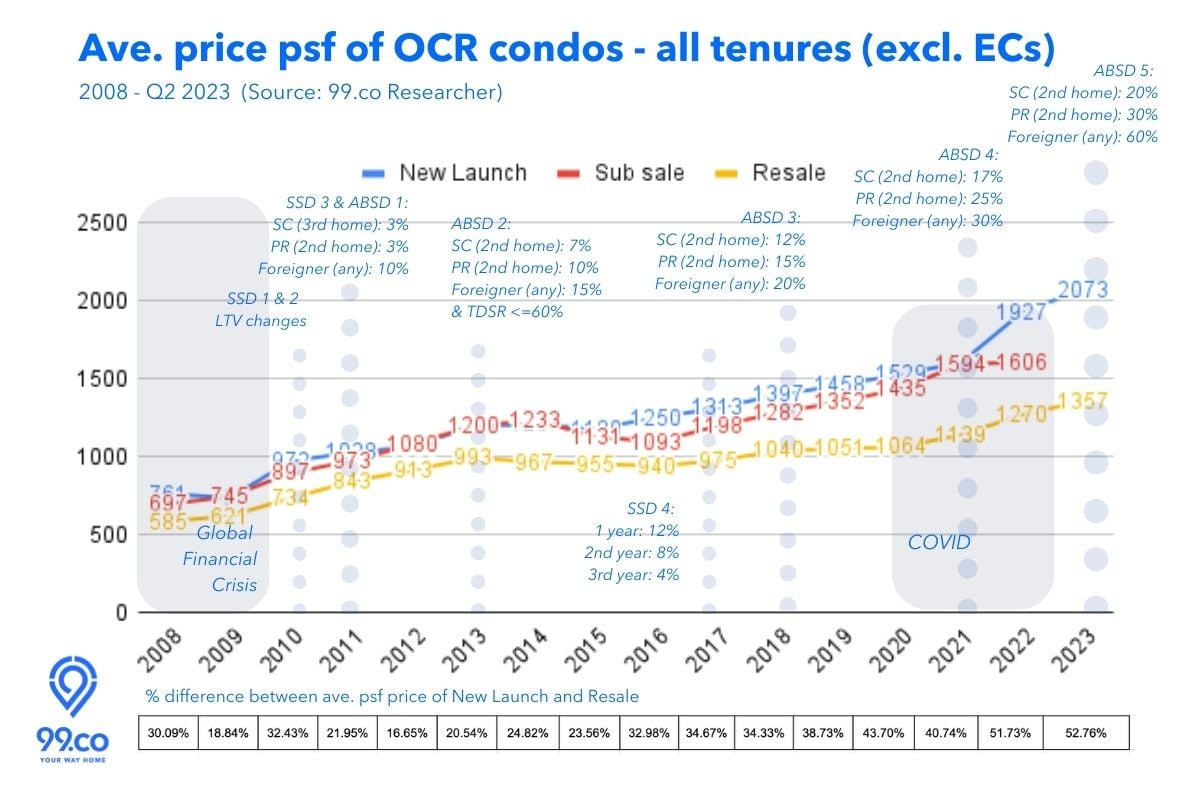 Contrary to popular belief, the largest gap between average psf prices of new launch condos and resale isn’t in the Core Central Region (CCR) but Outside Central Region (OCR).
As of Q2 2023, we see a 53% average psf price gap between new launch and resale condos in the OCR. This is higher than the 48% for the Rest of Central Region (RCR) and 35% for CCR.
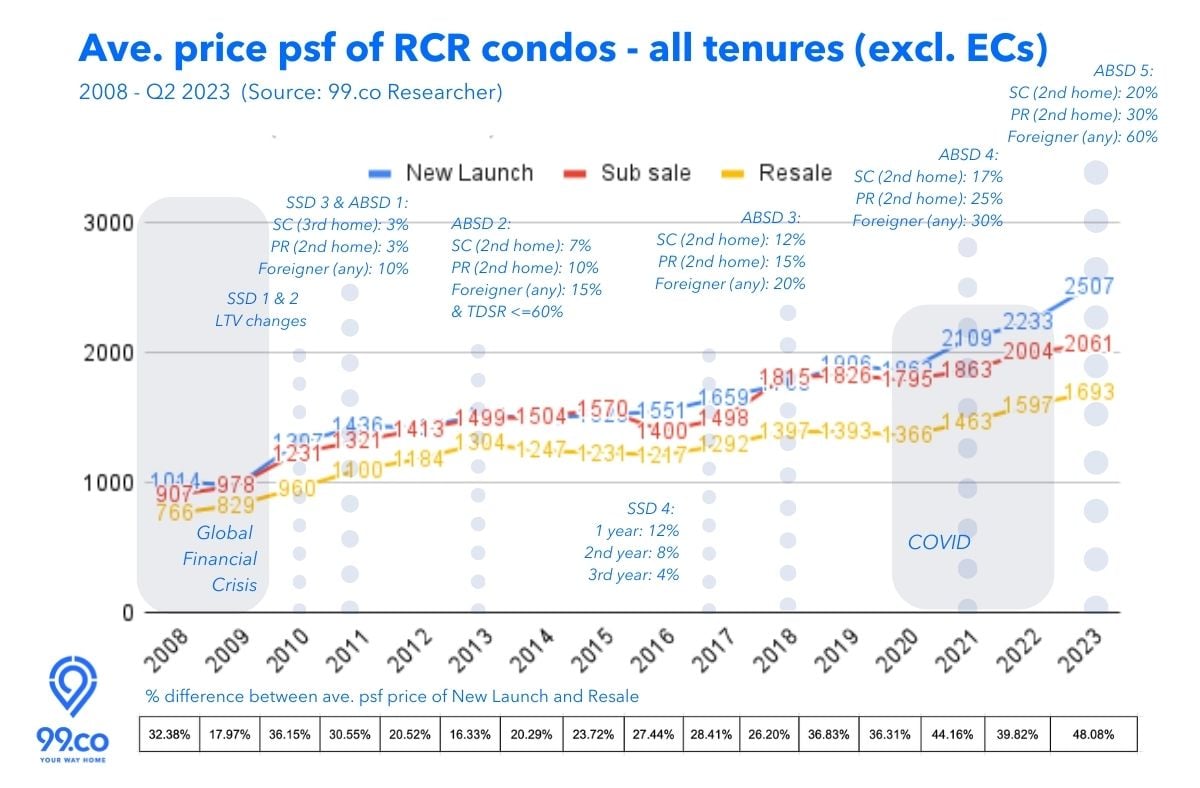
Between 2020 and 2023 (so far) – since COVID – average psf price growths of new launch condos in both OCR and RCR were highest – at 36% and 35%, respectively. For CCR, it was 16%.
However, over the same period, CCR condos registered the highest sub-sale price growth at 31% (as opposed to 18% and 15% for OCR and RCR, respectively).
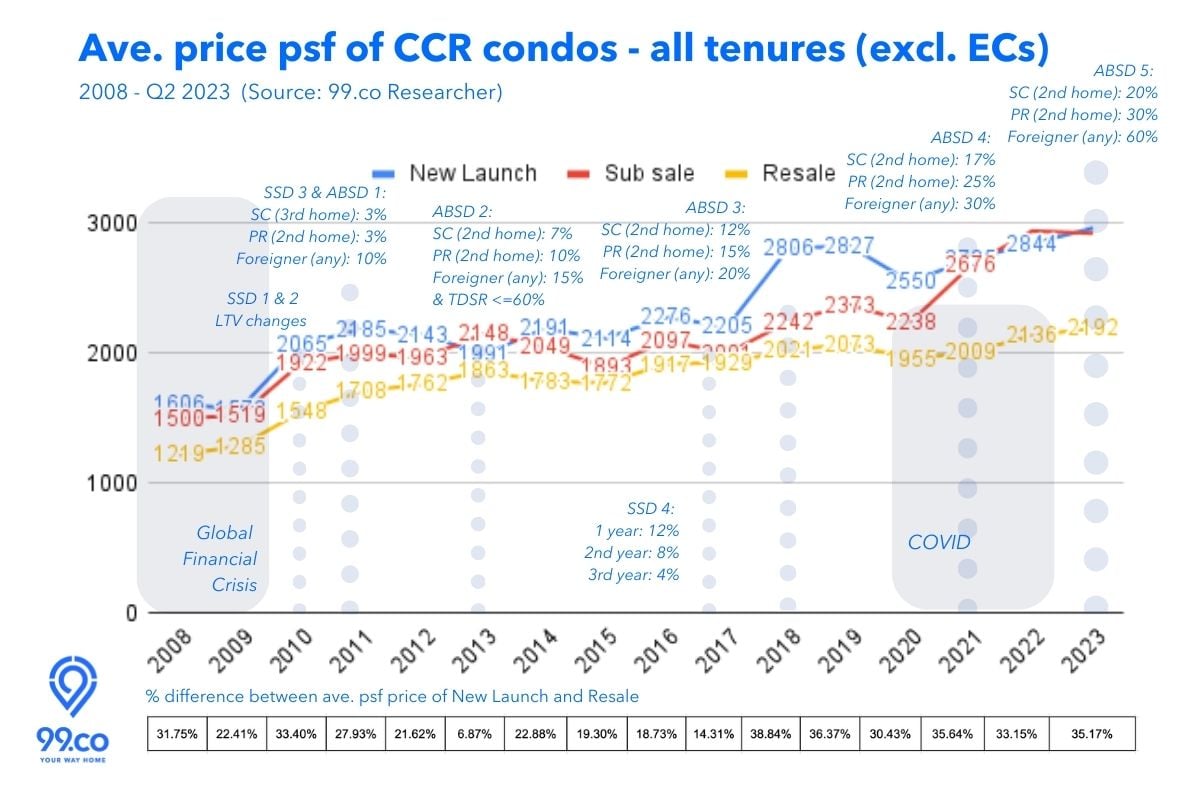 Finally, if we look back at when the SSD was relaxed in 2017 till before COVID in 2020 (ie. 2017-2019), average psf price growth of new launch condos was highest for CCR at 28%, as opposed to 11% for OCR and 15% for RCR.
In other words, before COVID, CCR new launch condos were the toast of the three regions in terms of fastest psf price growth. Since COVID, OCR condos have taken over that crown.
To answer the question – will we see similar patterns with resale and sub-sale prices? While it is unlikely for resale and sub-sale prices to trend as high as new launch condo prices, there is a new gap among them after COVID.
Based on 99.co Researcher data, for resale, over the past three years, there’s an average psf price gap of between 40-53% for OCR condos, 36-50% for RCR condos and 30-36% for CCR condos.
For the sub-sale market, the ranges are 1-22% (OCR), 4-22% (RCR) and -3 to 14% (CCR).
Note, however, that these are, after all, averages, so prices will vary based on property type, location and amenities.
–

3
3

3
2

3
2

3
3

3
2

3
2

3
2

3
2

3
2

3
2
–
Looking to sell your house to buy a new launch condo? Let us help you by connecting you with a property agent.
If you found this article helpful, 99.co recommends a Full list of new launch condos (with unsold units) approaching their developer ABSD deadlines in 2023/2024 and Where to buy a house to maximise your kid’s chances of getting into a popular primary school?
The post Analysis: When did the psf price for new launch condos widen from resale, and why appeared first on .
