Last week, the Department of Statistics released the census results, highlighting the various changes in Singapore’s resident population over the last decade. The census is done every 10 years. You can check out Part 1 and Part 2 of the census to find out more.
Anyway, among the statistics published, a few got our attention. Here’s what they can potentially mean for housing and the property sector in Singapore.
Racial disparity in HDB, condo and landed property residents
Taking a closer look at the breakdown based on race, we noticed more disparities across the property types. For instance, the proportion of Malay resident households living in condos was 3%, which was way lower than the 17.3% for the Chinese and 16.2% for the Indians.
Likewise, there’s a lower proportion of Malays living in landed properties at 0.7%, as compared to 3.9% for Indians and 5.6% for Chinese.
This difference was also more pronounced in one- and two-room flats, with 16.0% of Malays living in these flat types, in contrast to 5.1% for Chinese and 7.7% for Indians. What’s even more alarming was the increase in Malay households living in these types of flats over the decade, rising from 8.7% to 16%.
The racial disparity here signals a widening gap in accessibility to bigger flats and private housing. But more importantly, it highlights wealth and income inequality, especially given that housing is tied to wealth and income. For instance, the median household income from work was S$5,704 for Malays, S$7,972 for Chinese, S$8,500 for Indians.
Based on these figures, we can expect more interventions based on race. In fact, a programme aimed at providing support for Malay families in public rental flats was announced in the same week as the census, although not much is known about it.
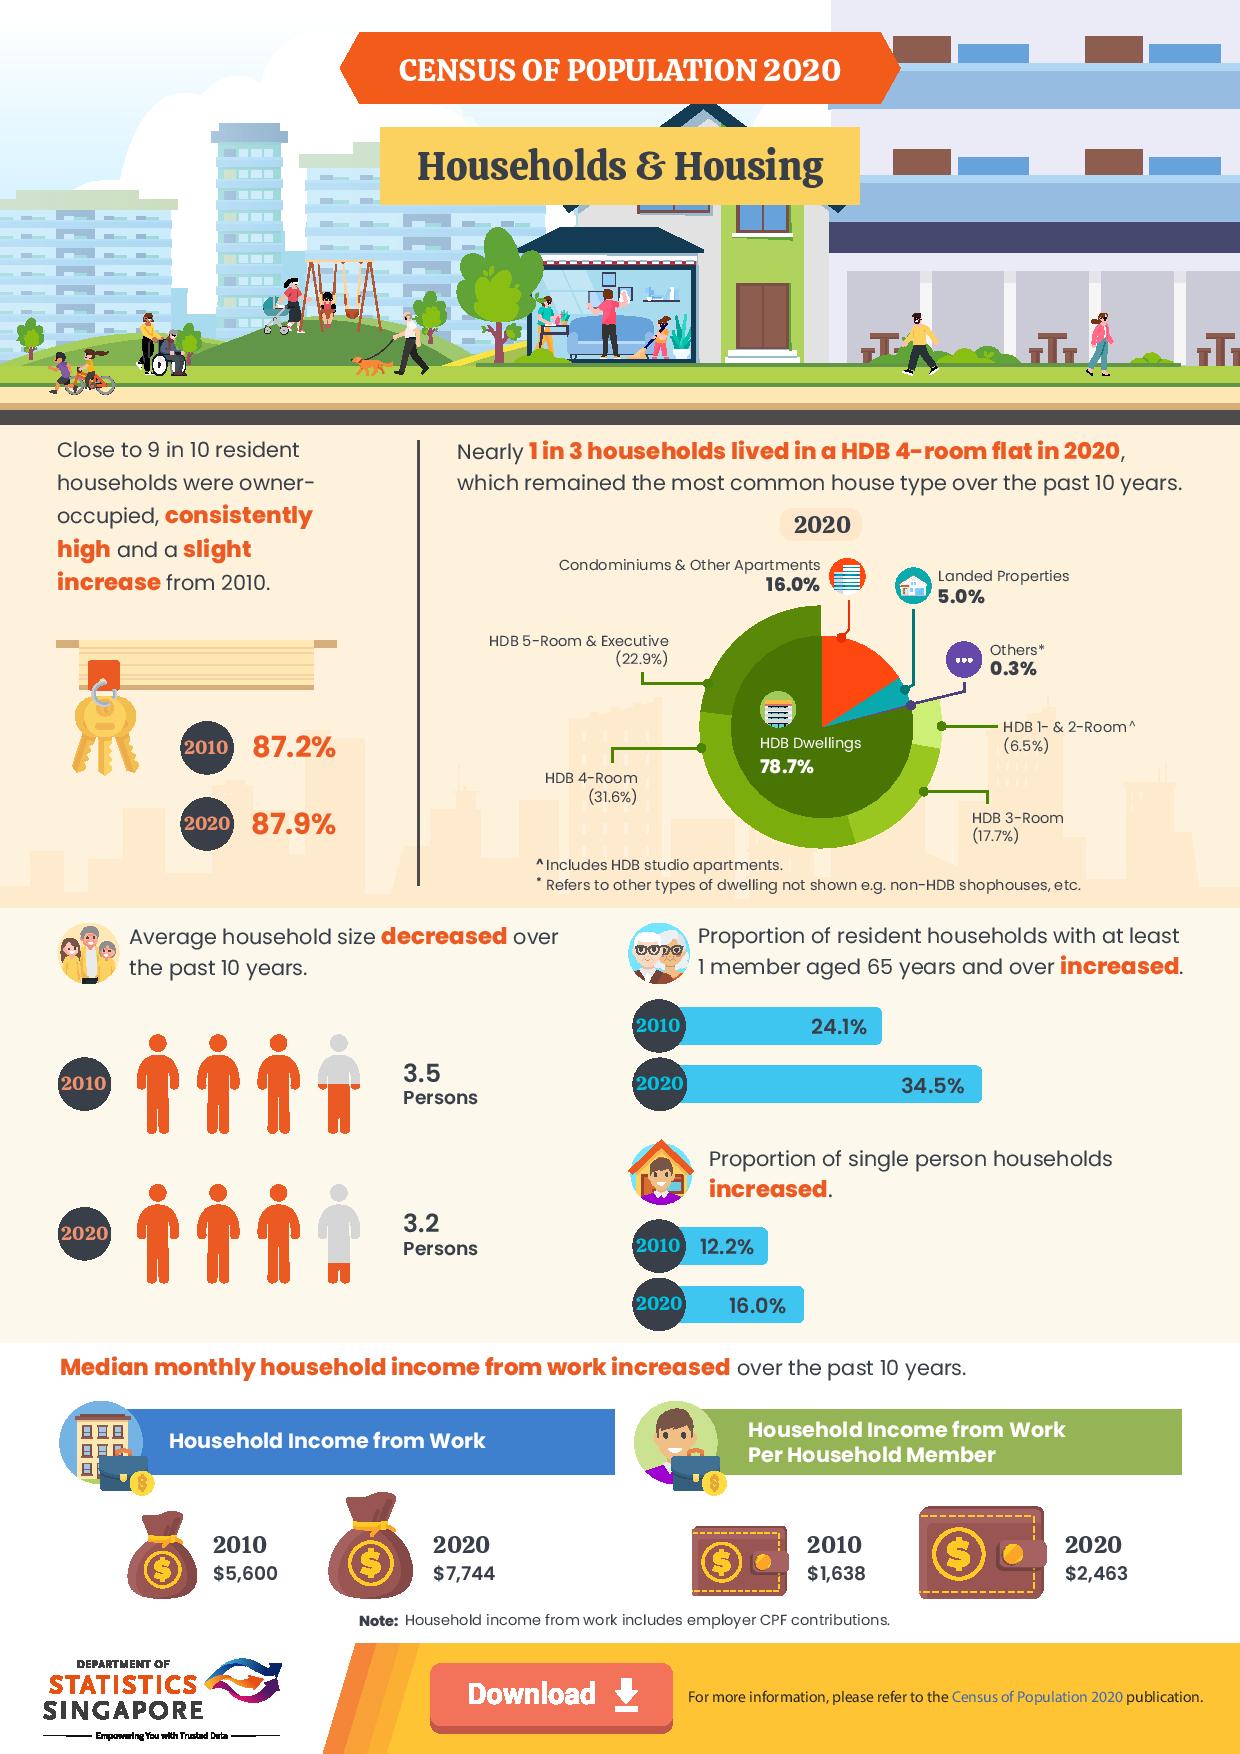
Smaller households
Another highlight of the census is that households are growing smaller. For instance, the average household size dropped from 3.5 persons in 2010 to 3.2 persons in 2020.
This is in line with current attitudes about marriage and having children, as fewer Singaporeans are getting married and having children. More are staying single as well.
The shrinking household size may give developers more reason to build smaller homes, which is a trend that we’re already seeing. For instance, they may decrease the number of four- and five-bedders even more, opting for smaller homes to maximise space and profit.
At the same time, there’s been a higher demand for bigger homes due to WFH, so we hope that developers will take this into account as well.
Longer travelling time
The median commuting time to get to work with MRT, LRT and buses was 60 minutes in 2020, longer than 50 minutes in 2010. The increase was also seen for students.
What’s interesting about this is that we’ve also seen the opening of two MRT lines, Circle Line and Downtown Line, over the past decade. So it can mean that given the improved connectivity, more people are actually willing to travel further for work and school. In fact, the census found that almost 80% of residents’ workplace was located in a different planning area from their homes.
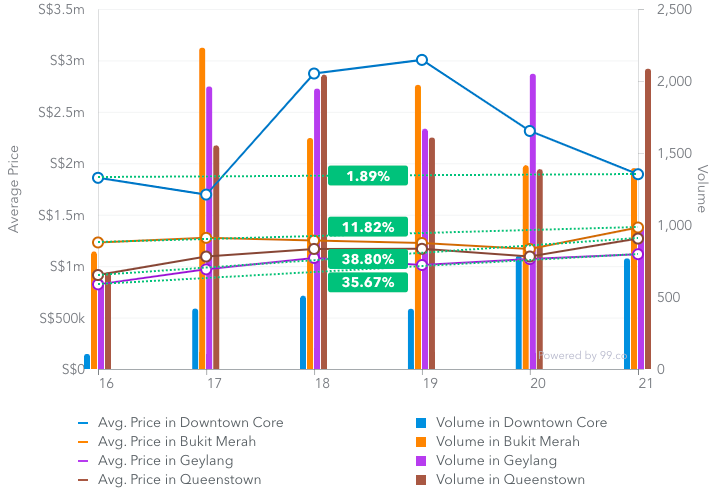
Top workplaces
The top workplaces in 2020 were Downtown Core, Queenstown, Geylang and Bukit Merah. Here are the percentages:
| Planning area | Percentage |
| Downtown Area | 12.9% |
| Queenstown | 6% |
| Geylang | 5.3% |
| Bukit Merah | 4.7% |
Right now, we’re already seeing residential areas being planned in these planning areas. On the public housing side, there’s the recent Bukit Merah and Geylang BTOs, as well as the upcoming Queenstown BTO. There are also plans to build public housing prime locations.
Likewise, these areas have been seeing price increases for resale properties. For instance, among the four planning areas, Queenstown has seen the highest price increase of 38.80%.
And with the recent census figures, these areas become even more attractive for developers. In line with the whole “live, work and play” concept, we may see more houses and lifestyle amenities built in these four areas. More integrated developments may even be planned in these areas.
While all these developments provide more convenience and cut down travelling time, it can also blur the lines between what it means to live, work and play. After all, as we’ve learned from the past one year, the importance of boundaries between work and home shouldn’t be understated.
—
If you found this article helpful, 99.co recommends Rejuvenating the Core Central Region: URA’s Master Plans for Orchard and Novena and MND really wants your suggestions on public housing in prime locations like the CBD.
Looking for a property to buy or rent? Find your dream home on Singapore’s largest property portal 99.co! If you have an interesting property-related story to share with us, drop us a message here – we’ll review it and get back to you.
The post What does the Census 2020 results mean for race, property types and future plans? appeared first on 99.co.
