It’s the last day of March, which also means the end of Q1 2022. URA’s official real estate quarterly statistics for Q1 2022 won’t be released until the end of next month. The agency will release flash estimates in early April, so that’s something to look forward to.
While we speculate on what those numbers may be, let’s look at some data so far and examine how different property types (HDB resale, private condo, ECs, landed housing) have performed before and after 16 December 2021’s cooling measures restrictions.
HDB Resale
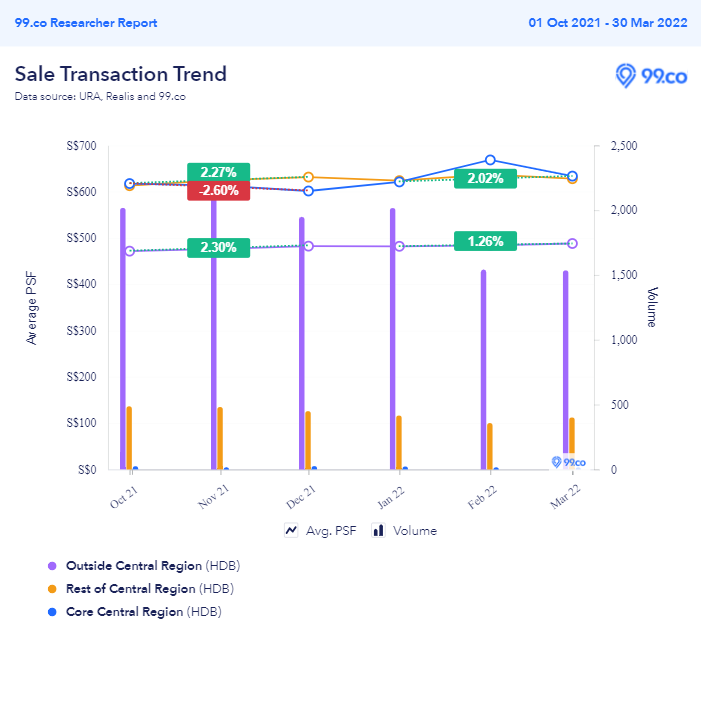
Between October and December 2021, HDB resale flats in the Core Central Region (CCR) saw average psf price dip by 2.60%. After December’s cooling measures, the average psf price seems to have gone back up by 2.02% across the quarter.
Similarly, flats in the Rest of the Central Region (RCR) like Toa Payoh, Bishan, Dawson and Telok Blangah, have seen a continued rise in average psf prices quarter to quarter. So does this mean the cooling measure’s restrictions have had no impact at all?
Far from it:
| HDB Resale | |||||||
| Oct-Dec 2021 | Jan-March 2022 (as of 30 March) |
||||||
| Average psf price change | Volume | Average psf price change | Volume | Volume change | Volume in Q1 2021 | Volume change from Q1 2021 | |
| CCR | -2.60% | 65 | 2.02% | 54 | -16.92% | 71 | -23.94% |
| RCR | 3.04% | 1417 | 2.02% | 1172 | -17.29% | 1382 | -15.20% |
| OCR | 2.30% | 6068 | 1.26% | 5093 | -16.07% | 5694 | -10.55% |
While average psf price appreciation has remained fairly positive, including some spikes in some months, don’t let that fool you.
The impact of the cooling measures is felt most in terms of transaction volume.
For example, HDB resale flats Outside of the Central Region (OCR) saw their volume drop from 2,016 in January to 1,542 and 1,532 in February and March respectively. Quarter-to-quarter, the drop has been in the range of 16-17%, but we should discount part of the slowdown on the lull over the Christmas and Chinese New Year seasons.
So we compared Q1 2022 volume against the same quarter (as of 30 March 2021) last year and the drop is still significant: between 10.55 and 23.94%.
Granted, the HDB resale market caters more for Singaporeans and PRs – who are mostly first-time homebuyers. This group is the least affected by the cooling measures especially the Additional Buyers’ Stamp Duty (ABSD). However, there is still some discernible effect, if we consider the lower Total Debt Servicing Ratio (TDSR) and HDB housing loan LTV limit.
Potential HDB sellers or upgraders may be hesitant, as they delay selling their flats to upgrade to condos. It’s also possible that the drop in psf price or volume is cushioned (as compared to private condos) as Singaporeans and Singaporean PRs choose to buy HDB resale flats instead of condos due to tightened loans limits.
–

3
2

4
3

3
2

2
1

3
2

3
2

3
3

4
2

3
3

2
2
–
Condos and Executive Condominiums
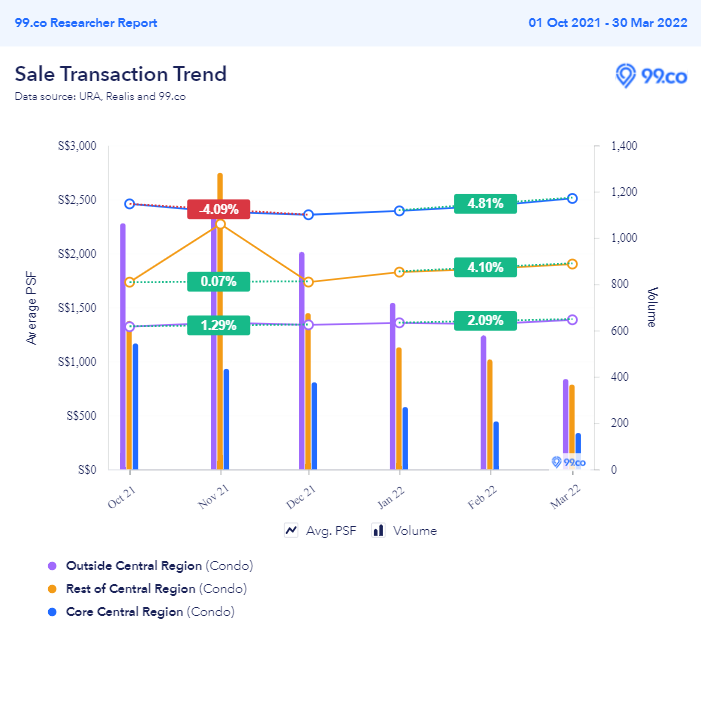
On the private condo front, there was an initial drop of 4.09% in average psf price in the Core Central Region between October and December 2021. However, that seems to have gone back up by 4.81% between January and March this year.
Similarly, there was an average psf price spike in the RCR in November last year. It’s likely this came from the launch of Canninghill Piers, with 5-bedrooms going for above S$3,000+ psf. That figure tapered down once again in December, before hiking 4.10% in psf price between January and March.
Once again, higher average psf prices do not necessarily mean volume is healthy. In fact, it could be the result of a few outlier transactions on a much smaller baseline (ie. lower volume).
Transaction volume in the CCR shows a decrease from 1,244 in Q4 2021 to 633 in Q1 2022 (as of 30 March). This is a 49.12% drop. Across all regions, the quarter-to-quarter drop is about 47%. This applies across all transaction types, be it new sales, sub-sales and resale.
If we compare over the same quarter last year, the drop is even greater, with CCR and RCR condos registering a volume decrease of more than 50% each. There were a few notable new launch sales last Q1 2021, such as Treasure at Tampines, Clavon and Normanton Park, while in Q1 2022, we’ve seen Royal Hallmark, Perfect Ten and Mori.
| Condominiums (excluding ECs) | |||||||
| Oct-Dec 2021 | Jan-March 2022 (as of 30 March) |
||||||
| Average psf price change | Volume | Average psf price change | Volume | Volume change | Volume in Q1 2021 | Volume change from Q1 2021 | |
| CCR | -4.09% | 1244 | 4.81% | 633 | -49.12% | 1339 | -52.73% |
| RCR | 0.07% | 2598 | 4.10% | 1369 | -47.31% | 2897 | -52.74% |
| OCR | 1.29% | 3151 | 2.09% | 1689 | -46.40% | 2756 | -38.72% |
–

3
3

2
2

3
3

2
2

3
3

3
3

2
2

3
2

2
2
3
3
–
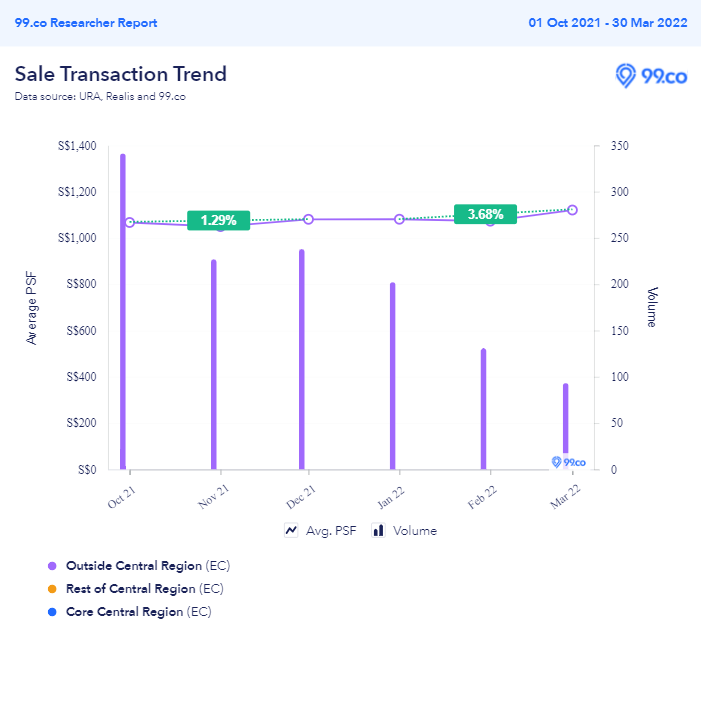
For executive condominiums, which are mainly in the OCR, the average psf price increased 3.68% between Jan-March 2022. However, volume decreased by 47.15% from quarter to quarter.
Compared to the same quarter last year, the volume has dropped even further by 61.79%. This is mainly because, in Q1 2021, there were more EC units transacted from the likes of Parc Central Residences, Ola, Piermont Grand and Parc Canberra. For Q1 2022, most of the transactions came from Parc Greenwich and Provence Residence.
This may change when North Gaia, the new EC in Yishun, launches in April. It’s a 616-unit executive condominium that’s close to several nature parks in Yishun and is right next to Sungei Khatib. As ECs follow HDB rules in terms of homeownership, expect a surge in demand in this category from first-time homeowners (who aren’t as affected by the cooling measures), or buyers who were initially on the fence between getting a private condo or applying for an EC.
| Executive Condominiums (ECs) | |||||||
| Oct-Dec 2021 | Jan-March 2022 (as of 30 March) |
||||||
| Average psf price change | Volume | Average psf price change | Volume | Volume change | Volume in Q1 2021 | Volume change from Q1 2021 | |
| OCR | 1.29% | 806 | 3.68% | 426 | -47.15% | 1115 | -61.79% |
 –
–

3
2

3
3

3
2
3
3

3
2
3
3
3
3

3
2

3
2

3
2
–
Landed Houses
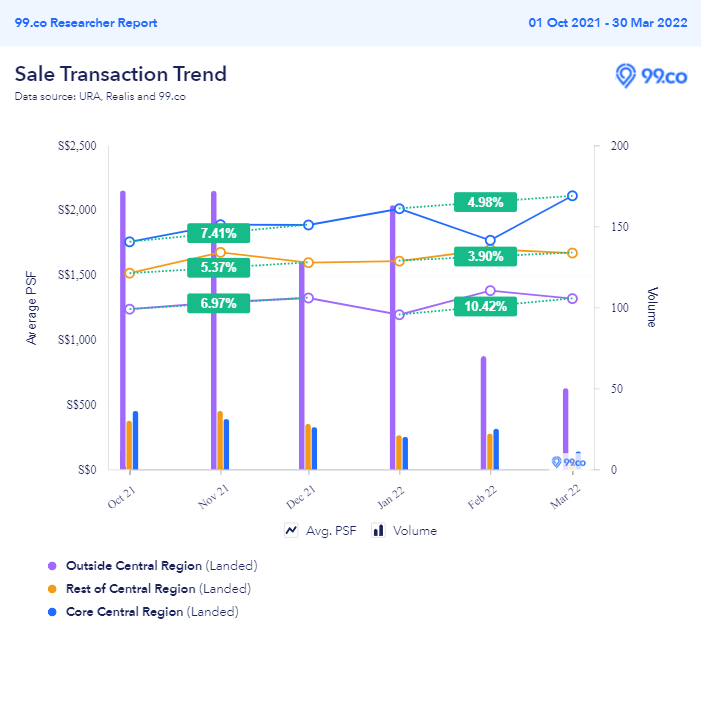
For landed homes, average psf prices continue trending upwards across all three regions – albeit on a more cautious note in the past recent quarter.
In terms of volume, the largest drop came from RCR, particularly in March 2022, with only 7 registered transactions so far. Also, if you’re wondering about January’s OCR spike in volume, that’s most likely from the sale of strata-landed housing at Belgravia Ace. So it is prudent to note that while there are trendlines when comparing quarter-to-quarter data, there are also spikes and plunges due to new launches (or the lack thereof) within the sector.
The sell-out performance of Belgravia Ace may have contributed to average psf pricing increasing from 6.97% in Q4 2021 to 10.42% in Q1 2022.
Still, transaction volume for this region has fallen from 472 last quarter to 283 between January and March 2022. While some may attribute this 40.04% fall to seasonal factors like Christmas, the Lunar New Year or pandemic restrictions (that reduced the pool of potential foreign buyers), a comparison with volume transactions from Q1 2021 shows a similar 38.74% drop.
| Landed Houses | |||||||
| Oct-Dec 2021 | Jan-March 2022 (as of 30 March) |
||||||
| Average psf price change | Volume | Average psf price change | Volume | Volume change | Volume in Q1 2021 | Volume change from Q1 2021 | |
| CCR | 7.41% | 93 | 4.98% | 56 | -39.78% | 131 | -57.25% |
| RCR | 5.37% | 94 | 3.90% | 50 | -46.81% | 109 | -54.13% |
| OCR | 6.97% | 472 | 10.42% | 283 | -40.04% | 462 | -38.74% |
–

5
4

5
4

5
4

5
4

5
4

5
5

5
6

4
4

5
5

4
3
–
Whether it’s a quarter-to-quarter comparison or a comparison with the same quarter last year, transaction volumes across different property types have slowed down by about 40-60%. The exception is with the HDB resale market, where transactions decreased by 11 to 24% depending on which region. This is because HDB resale flats are only applicable to Singaporeans and PRs, most of whom are first-time buyers and are unaffected by the December cooling measures.
The strain could most likely be felt among HDB owners whose MOPs are up and intending to upgrade to say a condo or landed house. As they stay put and delay their upgrading plans, this creates a spillover effect on private condos.
In this property type, OCR condo developments seem to be the least impacted among the three regions, but it’s still a double-digit drop in volume. At least, across all three regions, average psf pricing is still on an uptrend (for now).
For landed housing, OCR projects seem to be the most resilient so far, with a double-digit uptick (10.42%) in average psf pricing between January and March (possibly due to Belgravia Ace’s performance). Its volume drop of no more than 40% quarter-to-quarter is also one of the lowest among private housing types.
Despite the drop in volume and cooling measures in place, demand for private landed housing remains positive among high net-worth individuals and their families as of Q1 2022.
–
Do you have any other insights to share based on these data? Let us know in the comments section below or on our Facebook post.
If you found this article helpful, 99.co recommends Cooling measures announced – ABSD, TDSR and LTV – effective from midnight 16 December 2021 and Do new launch condos with fast take-up rates perform just as well in the resale market?
Looking for a property? Find the home of your dreams today on Singapore’s fastest-growing property portal 99.co! If you would like to estimate the potential value of your property, check out 99.co’s Property Value Tool for free. Also, don’t forget to join our Facebook community page or Telegram chat group! Meanwhile, if you have an interesting property-related story to share with us, drop us a message here — and we’ll review it and get back to you.
The post How different properties performed in Q1 2022 after 16 Dec’s cooling measures appeared first on 99.co.
