What’s causing the fluctuations in leasing activity and rents of private non-landed properties in Singapore? The average size of apartments leased has been falling down from about 1,200 sq ft to about 1,075 sq ft over the period. One reason is that the stock of smaller apartments has been rising.
By David Dickinson
Last time we looked at how leasing activity and rents fluctuate from month to month each year. I plotted the monthly variations in total and per square foot (PSF) rents over the last four years. Total rents (orange bars in Figure 1) appeared to be highest in the July to September period and lowest in November and December, while rents measured on a PSF basis were on average higher in April and lowest in June and December.

Figure 1
We now take a closer look at what might be causing these fluctuations. Figure 2 shows the average size of private non-landed properties leased out in Singapore each month from 2014 to 2018 together with a trend line. It’s obvious that the average size of apartments leased has been falling, down from about 1,200 sq ft to about 1,075 sq ft over the period. This is mostly because the stock of smaller apartments has been rising.
Looking for a rental property in Singapore? Find an agent to take the hassle out of your home search.
But around this trend is a fluctuation in the average size of units leased from month to month, with units being noticeably larger in July and August every year and smallest around April.
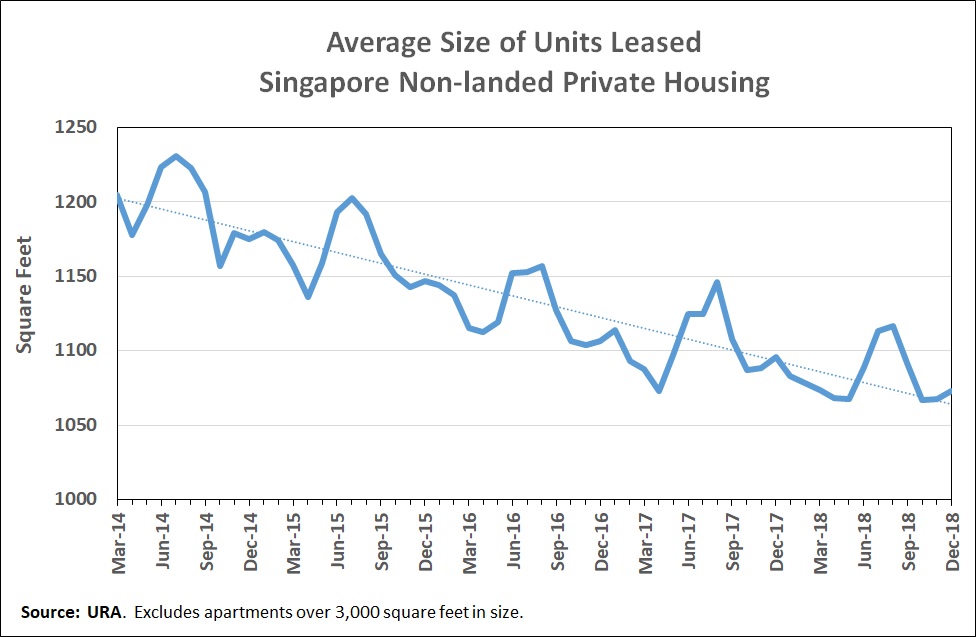
Figure 2
In order to explore monthly leasing activity across units of different sizes, I grouped leases into three size categories; units under 1,000 sq ft, 1,000 to 2,000 sq ft and units over 2,000 sq ft. I then converted the number of leases every month to an index starting at 100 in March 2014. The index for units under 1,000 sq ft was adjusted for the increase in the relative amount of stock in this size category in order to make comparisons easier.
Figure 3 shows the resulting index every month from March 2014. While there are consistent monthly variations across all the size groups, they are very pronounced for units over 2,000 sq ft (grey line) with extremely high July and August peaks.

Figure 3
Leasing for smaller apartments is not as volatile month-to-month, and while there are also July and August peaks, there is another peak in April, particularly for units under 1,000 sq ft.
Are rents also higher during the peak leasing months?
Let’s firstly look at larger apartments. I selected leases in districts 9, 10 and 11 for apartments between 2,000 and 3,000 sq m in size and show average rents on a PSF basis* in Figure 4.

Figure 4
The volume of leasing is very high in July and August and rents are also noticeably higher in these months, suggesting that there may be an advantage for landlords to market larger properties at this time when there are likely to be more tenants looking for properties. But there are other possible reasons for higher rents. For example, the most luxurious large apartments could be more likely to be leased at that time of the year when expatriates are most active. Also, a relatively large proportion of leases could be renewals and they might not fully reflect current market conditions, or perhaps corporate leases are more common at that time of year and maybe companies are more generous than tenants on private leases. Whatever the reasons, the peaks are very evident and the last six months of 2018 show a difference in average rents from a peak of $3.66 psf in August and an average of $3.25 psf from October to December.
What is the seasonal pattern for smaller apartments? Here I look at units under 800 sq ft in the inner districts 1, 2 and 9 as they had the highest average rents PSF for small apartments and relatively high levels of leasing activity in the segment.
Looking at leasing volume, April is consistently the strongest month, but July to September was strong in some years, especially last year. The high levels of unit completions may have influenced leasing levels as units are put on the rental market for the first time, so we need to be careful in making conclusions as this may help explain the less apparent seasonality.
Rents also do not seem to have the pronounced July and August peaks we can see for large apartments. In 2018, average rents were highest from January to April but fell since about May. This might also be due to completions of new units, but might be influenced by a margin of error in my rent calculations** as they are based on the mid-points of the unit size bands reported by URA for each lease.
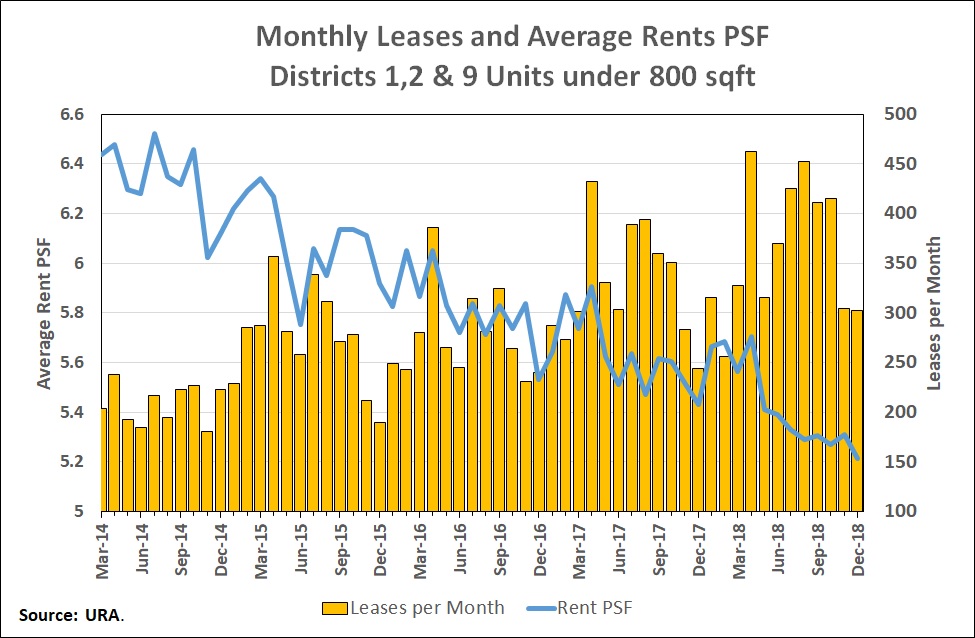
Figure 5
It seems that the leasing of smaller units is not as seasonal as for larger apartments and there is certainly less evidence of rents spiking higher in line with activity levels, though there is a puzzling April peak in or near the CBD. This however disappears in districts further from the CBD, such as Districts 14 and 15, which also have a lot of leases for smaller units. As new supply slows, it will be worth keeping an eye on the leasing of smaller apartments to see whether these patterns stay the same. In the meantime, I will be hunting for a more accurate way to measure PSF rents .
*The average rent per square foot is based on the mid-point of the size bands reported by the URA for each lease. For example, if the size band for a lease was 2,300 to 2,400 square feet, I adopted 2,350 square feet to derive the rent per square foot.
**For small apartments, the margin of error in estimating the rent per square foot increases because the URA publishes fixed size bands of 100 sq ft irrespective of unit size. Therefore adopting the mid-point of 450 sq ft for a unit reported as being between 400 to 500 sq ft in size will result in a less precise rent estimate than for larger units. With large numbers of transitions, the bias may to some extent be cancelled out when calculating averages, but even so, care needs to be taken in drawing conclusions using this estimation method.
Check out PropertyGuru’s properties for rent! Alternately, refer to our other handy rental guides, or read more about the hottest areas to live in with PropertyGuru’s AreaInsider
