The Little India area continues to attract expat tenants with its distinct charm and character, as well as its proximity to the city centre.
By David Dickinson
Last time I looked at the most leased and owner-occupied projects in Singapore. Based on the top 10 developments in these categories, it appeared that those in the central areas were more likely to be leased and that older developments might have more owner-occupiers. Also, smaller projects and those containing smaller-sized units might have more rented apartments. Let’s look at this more closely by using the Lease Ratio again. As you may recall, this measures the number of leases registered for every 100 units each year. I look at leases over the last four years in private condominium and apartment projects completed up to 2015.
Lease Ratios by District
As expected, projects in the CBD and adjacent districts had the highest Lease Ratios. In Figure 1, Districts 2 and 1 were highest at 53 and 46 leases per 100 units respectively, about double the average for Singapore. Little India (District 8) was the next highest at 38 followed by the Harbourfront area (District 4) on 36 and Districts 6 and 7 covering the Beach Road to Bencoolen areas at 35. The traditional rental districts 9, 10 and 11 were also above average at 33, 29 and 31 leases per 100 properties respectively.
Looking for a rental property in Singapore? Find an agent to take the hassle out of your home search.
The district with the lowest Lease Ratio was 26 ((Mandai/Upper Thomson), with only 13 leases per 100 units every year followed by Districts 20 ((Ang Mo Kio/Bishan/Thomson), 23 (Dairy Farm to Choa Chu Kang) and 27 ((Sembawang/Yishun) with 16 each.
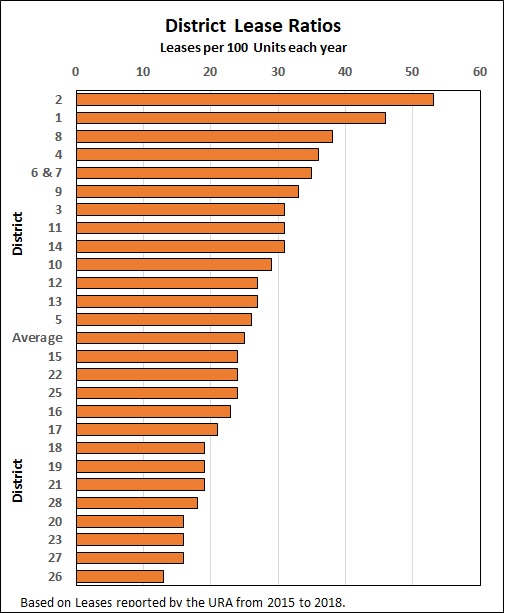
Figure 1
…by Age of Project
Older projects do have fewer leases than newer projects, suggesting they may contain more owner-occupiers. Figure 2 shows that there were about 23 leases per 100 units in projects completed between 1990 and 2009 compared to 32 in projects completed from 2010. The ratio for the oldest projects built before 1990 was lowest at 18, though this may have been influenced by en bloc fever, with some owners not wanting to lease their properties if a sale was expected.

Figure 2
…. by unit size*
As would probably be expected, projects containing smaller units have much higher Lease Ratios than projects containing larger units, though amongst projects with average unit sizes that exceed about 1,500 sqft the ratio rises (see Figure 3). The main reason for this could be due to concentrations of projects with larger apartments in districts popular for leasing by families, such as District 10. The extent of leasing in projects with smaller units might be interesting to explore more, especially given the Government’s recent changes to development controls on unit sizes.

Figure 3
… by size of project
I also expected that projects with smaller numbers of units might have higher Lease Ratios. To see whether this is generally true, Figure 4 shows the average leasing ratio by project size. The results here are not so clear cut. Yes, projects of under 250 units do have higher lease ratios at 28, but large projects of over 750 apartments also have higher than average ratios. Size may have some influence on leasing activity, but other factors such as project age, location or unit size might be more important.

Figure 4
So what are the take-away’s? Leasing activity is definitively higher in and near central areas, in newer projects and amongst smaller units. Should landlords therefore focus on these types of projects? Maybe yes and maybe no. We have just looked at lease volumes. Assuming most landlords are also investors, then it’s the total return that matters and this is driven by and a combination of rental yields and capital growth. Just buying smaller, newer and more centrally located apartments may or may not provide the best returns. Till next time.
*The average size of units in a project was based on all the leases over four years in a project. By using this method, there may be some bias if, for example, larger units in a project were leased less than smaller units. I have checked the average unit sizes in projects based on this method against the average sizes of units sold in the same projects and the differences are not large enough to materially affect the overall results shown here.
Check out PropertyGuru’s properties for rent! Alternately, refer to our other handy rental guides, or read more about the hottest areas to live in with PropertyGuru’s AreaInsider
