Could there be a time of the year when activity and rents are higher or lower irrespective of position in the property cycle? We break it down for you.
By David Dickinson
When is the best time to lease an apartment in Singapore? There’s an obvious answer, right? When the market is at the bottom if you are a tenant, and at the top if you are a landlord. Well yes, but could there be a time of the year when activity and rents are higher or lower irrespective of position in the property cycle?
Looking for a rental property in Singapore? Find an agent to take the hassle out of your home search.
Statisticians refer to repetitive ups and downs in numbers at certain times of the year as seasonality and official statistics are often adjusted to remove them. I am pretty sure Singapore’s rental indices are adjusted for seasonality, but knowing the impact of seasonality can be useful.
Today I will take a look at seasonality by looking at leases for non-landed private properties registered every month.
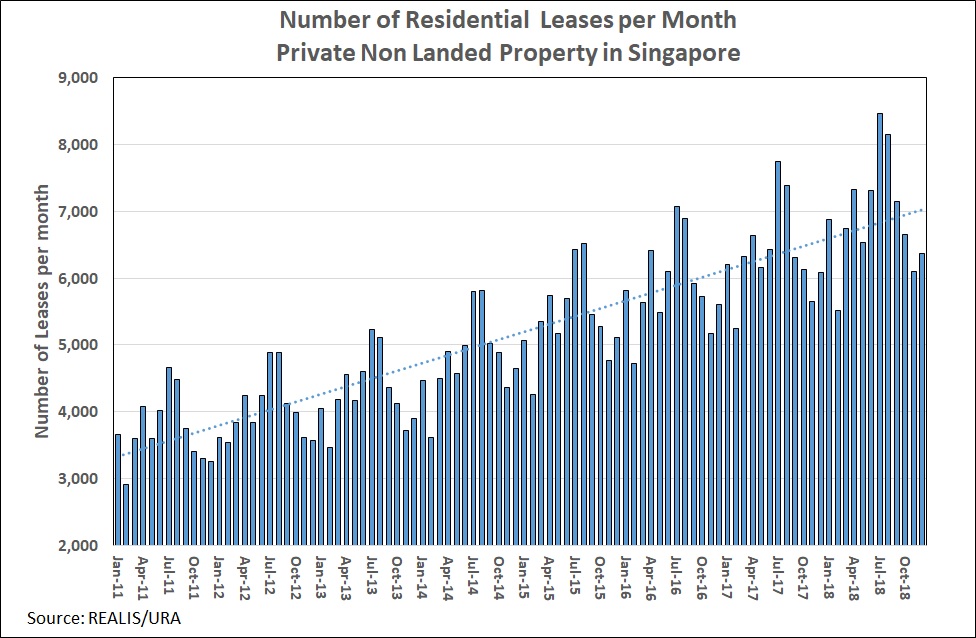
Figure 1
In Figure 1 you can see that the number of new leases every month varies greatly. They are highest in July and August and lowest in February and the October through December period. February is low as it is a short month and usually contains the Chinese New Year holiday period. Perhaps the long school holiday months of June and December are also not so good for leasing. But why are the months of July and August so strong? It might be because the expatriate market is most active at that time. Perhaps companies are more likely to move their staff during the long northern hemisphere summer holiday break.
Figure 2 wraps some numbers around the monthly ups and downs so evident in Figure 1.

Figure 2
In July and August, the volume of leasing activity was, on average, 20 percent and 17 percent higher respectively than the annual average level of leasing. April was also stronger, at about seven percent higher. The worst month was February at -18 percent, followed by November at -14 percent and December at -12 percent. I guess the takeaways are that property agents should never book holidays in July and August and renters might encounter more competition.
But what about rents? Do they also fluctuate through the year? Figure 3 shows rents measured two ways; firstly the monthly median rent per square foot (blue line), and secondly the average monthly total rent (orange line).
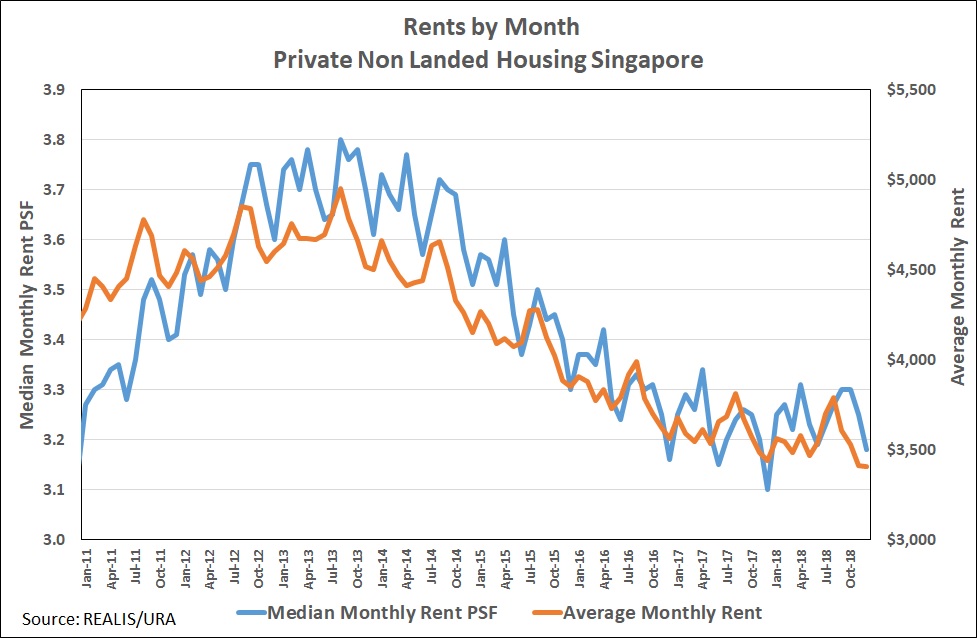
Figure 3
It’s also obvious that both rent series have seasonal variations, but what’s interesting is that they are somewhat different. Let’s look at Figure 4 to see how different by looking at how much monthly rents deviate from the surrounding trend*.

Figure 4
The total monthly rent (the orange bars) is relatively higher every year in the July through September period, peaking in August when rents are about six percent higher than the average for the year. When measured on a PSF basis (the blue bars), the variation in rents over the year are not so wide, though they are about two percent higher than average in April, August and September, and two to three percent lower in June and December.
What is going on here? Are rentals really higher in some months than others? Perhaps, though I suspect there are other reasons. For example, higher total average rents every August might be influenced by relatively more leases for higher-rental apartments.
The monthly variations in rents measured on a PSF basis are not as extreme. The lower rents in June and December are probably due to the holiday periods, but the higher rents in April is puzzling.
I would hold off concluding that there are certain months favourable to be leasing for landlords or tenants until we have looked more closely at the data as the variations might be explained by differences in leasing activity between districts and unit sizes. Till next time.
*The following method was used to estimate the monthly deviations in leasing volume and rents. Using rents to illustrate, their average deviations in a month is based on the rent in that month as a percentage of the average rent over the surrounding 12 months (i.e. June in each year is relative to the January to December average, July is relative to the February to January average, and so forth). The deviations for the same month in each year from mid-2010 to mid-2018 are then averaged. Sharp underlying market ups and downs and high levels of new stock completions over short periods can influence these average monthly deviations.
Check out PropertyGuru’s properties for rent! Alternately, refer to our other handy rental guides, or read more about the hottest areas to live in with PropertyGuru’s AreaInsider
