Singapore’s rental market is on a tear, particularly in the 3rd quarter of 2022, which is no understatement.
The signs have been there since 2020 when COVID, circuit-breaker, home-based schooling and work-from-home policies forced many to explore temporary housing options like renting.
Yet, in 2022, as office workers return to the workplace and kids back to school, rental prices continue to rise unabated.
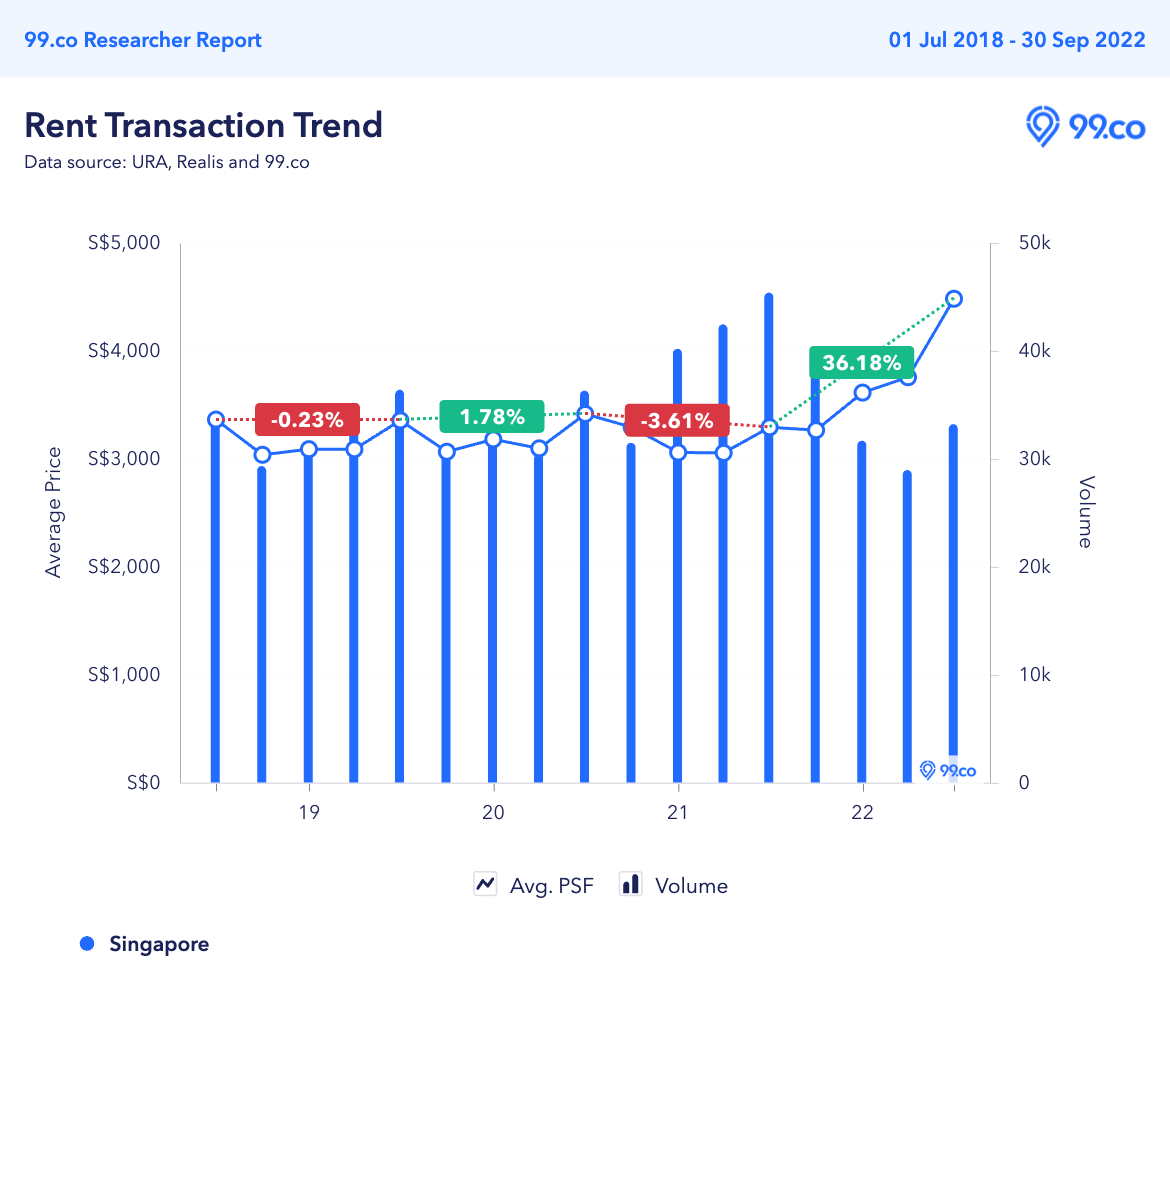
Between Q3 2021 and Q3 2022, average rent prices in Singapore (all properties) rose 36.18%, a double-digit surge compared to the Q3-to-Q3 comparisons for 2018-2019 (-0.23%), 2019-2020 (1.78%) and 2020-2021 (-3.61%).
This should ring some alarm bells for the authorities.
If we drill down to just the first nine months of 2022, we can see that the average psf price for rents in Singapore has risen 21.92%.
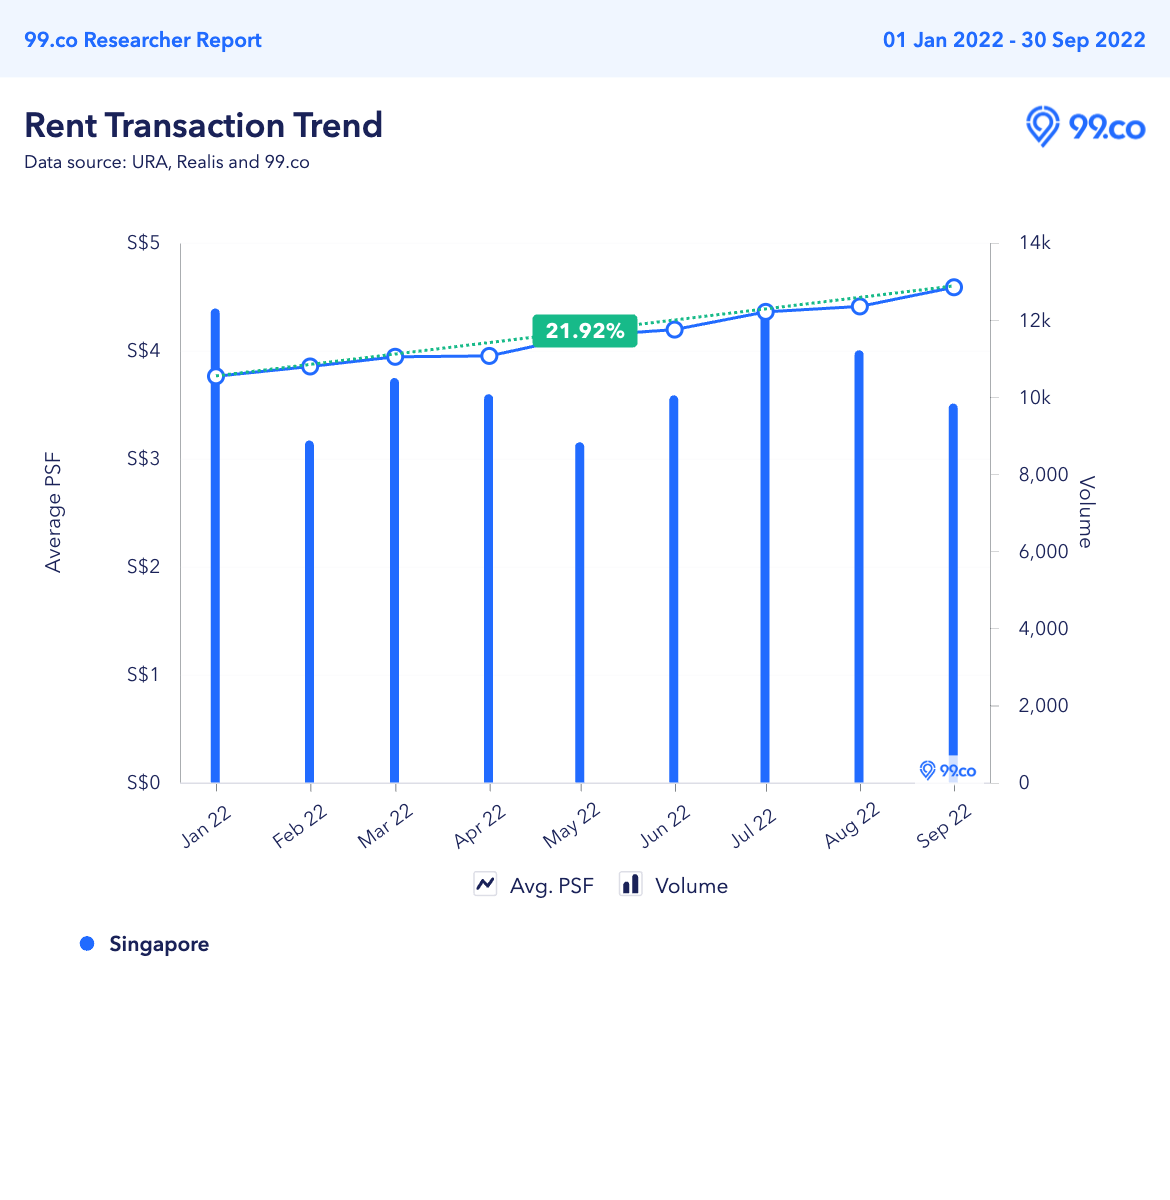 In other words, a 1,000-square-foot condo apartment would see its average rent price rise from S$3.76 psf (S$3,760 per month) in January to S$4.58 psf (S$4,580) in September – a whopping S$820 rise in just nine months.
That’s a lot of money spent just to stay under one roof – considering households also face inflation, higher interest rates and an impending 8% GST in 2023 and 9% in 2024.
This also explains why existing tenants are renewing their leases for 2-year terms to lock in their rental prices before their landlords have a change of heart (or minds) to increase rent prices even more.
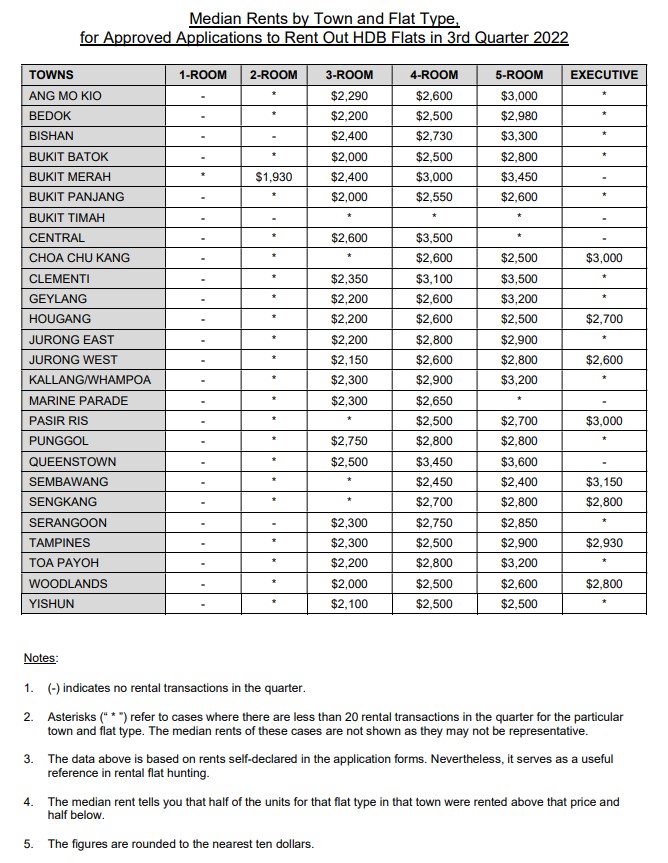
HDB Median Rent
Last week, HDB released median rents by town and flat type for Q3 2022.
The Q3 2022 numbers only tell part of the story. Let’s look at median rents for 4-room HDB flats across previous quarters to better understand how severe rental prices have surged for HDB flats.
| Median Rents for 4-room HDB Flats | ||||||
| Q3 2021 | Q4 2021 | Q1 2022 | Q2 2022 | Q3 2022 | Q3 to Q3 | |
| Central | 2800 | 2800 | 3000 | 3050 | 3500 | 25.00% |
| Queenstown | 2750 | 2730 | 2900 | 2900 | 3450 | 25.45% |
| Clementi | 2500 | 2550 | 2600 | 2700 | 3100 | 24.00% |
| Bukit Merah | 2600 | 2670 | 2800 | 2900 | 3000 | 15.38% |
| Kallang/ Whampoa | 2500 | 2550 | 2600 | 2700 | 2900 | 16.00% |
| Jurong East | 2200 | 2200 | 2300 | 2350 | 2800 | 27.27% |
| Toa Payoh | 2300 | 2500 | 2450 | 2600 | 2800 | 21.74% |
| Punggol | 2000 | 2100 | 2300 | 2500 | 2800 | 40.00% |
| Serangoon | 2300 | 2300 | 2300 | 2500 | 2750 | 19.57% |
| Bishan | 2400 | 2400 | 2500 | 2600 | 2730 | 13.75% |
| Sengkang | 2100 | 2100 | 2200 | 2300 | 2700 | 28.57% |
| Marine Parade | 2200 | 2480 | 2300 | 2430 | 2650 | 20.45% |
| Ang Mo Kio | 2200 | 2300 | 2350 | 2400 | 2600 | 18.18% |
| Choa Chu Kang | 2000 | 2000 | 2050 | 2200 | 2600 | 30.00% |
| Geylang | 2400 | 2400 | 2500 | 2400 | 2600 | 8.33% |
| Hougang | 2030 | 2150 | 2200 | 2200 | 2600 | 28.08% |
| Jurong West | 2150 | 2200 | 2200 | 2400 | 2600 | 20.93% |
| Bukit Panjang | 2000 | 2000 | 2100 | 2300 | 2550 | 27.50% |
| Bedok | 2200 | 2250 | 2200 | 2400 | 2500 | 13.64% |
| Bukit Batok | 2100 | 2100 | 2100 | 2400 | 2500 | 19.05% |
| Pasir Ris | 2050 | 2100 | 2200 | 2300 | 2500 | 21.95% |
| Tampines | 2200 | 2200 | 2300 | 2350 | 2500 | 13.64% |
| Woodlands | 1900 | 2000 | 2100 | 2300 | 2500 | 31.58% |
| Yishun | 2000 | 2000 | 2100 | 2250 | 2500 | 25.00% |
| Sembawang | 1900 | 2000 | 2100 | 2200 | 2450 | 28.95% |
So here are some findings:
- Across all estates (with the exception of Bukit Timah, which has no rental transactions), median rents have risen across the board over the past year.
- The highest Q3-to-Q3 rise for 4-room flats is in Punggol, which rose from S$2,000 to S$2800, a 40% increase!
- Similarly, when we looked at the median rents for 3-room and 5-room HDB flats between Q3 2021 and Q3 2022, Punggol tops both lists with a S$1,950 to S$2,750 rise for 3-rooms (41.03%) and S$2,000 to S$2,800 for 5-rooms (40%).
- The next highest quarter-to-quarter rise for 4-room flats is in Woodlands, which rose from S$1,900 to S$2,500, a 31.58% increase. This is followed by Choa Chu Kang, which rose from S$2,000 to S$2,600, a 30% rise.
- The lowest quarter-to-quarter rise is Geylang, which rose from S$2,400 to S$2,600, an 8.33% rise. It is also the only estate on the list to have risen by a single-digit percentage. Bedok and Tampines are the next lowest, rising from S$2,200 to S$2,500, or 13.64%.
- In terms of estate type, the Q3-to-Q3 rise for 4-room flats in non-mature estates is from 19.05% to 40%, with the highest rises in Choa Chu Kang, Woodlands and Punggol. For mature estates, it’s 8.33% to 20.45%, with the highest rises in Clementi, Central and Queenstown.
- For 3-room flats, non-mature estates registered a range between 14.29% to 41.03% – with the highest rises in Yishun, Hougang and Punggol. Mature estates saw a range between 15% to 26.32%, with the highest rises in Tampines, Queenstown and Bishan.
- For 5-room flats, non-mature estates registered median rent increases from 13.64% to 40%, with the highest rises in Woodlands, Sengkang and Punggol. For mature estates, the range is from 14% to 29.63%, with the highest rises in Tampines, Bishan and Clementi.
- This shows that most median rent increases are in non-mature estates, with Punggol and Woodlands consistently on top. For mature estates, the rise is more evenly spread out, with Queenstown, Tampines and Clementi being on top.
Seeing double with rental trendlines: HDBs, Condos and ECs in Punggol
Since Punggol has the highest median rent rise (40-41%!) from Q3 2021 to Q3 2022, we think it’s apt to look deeper at the estate itself.
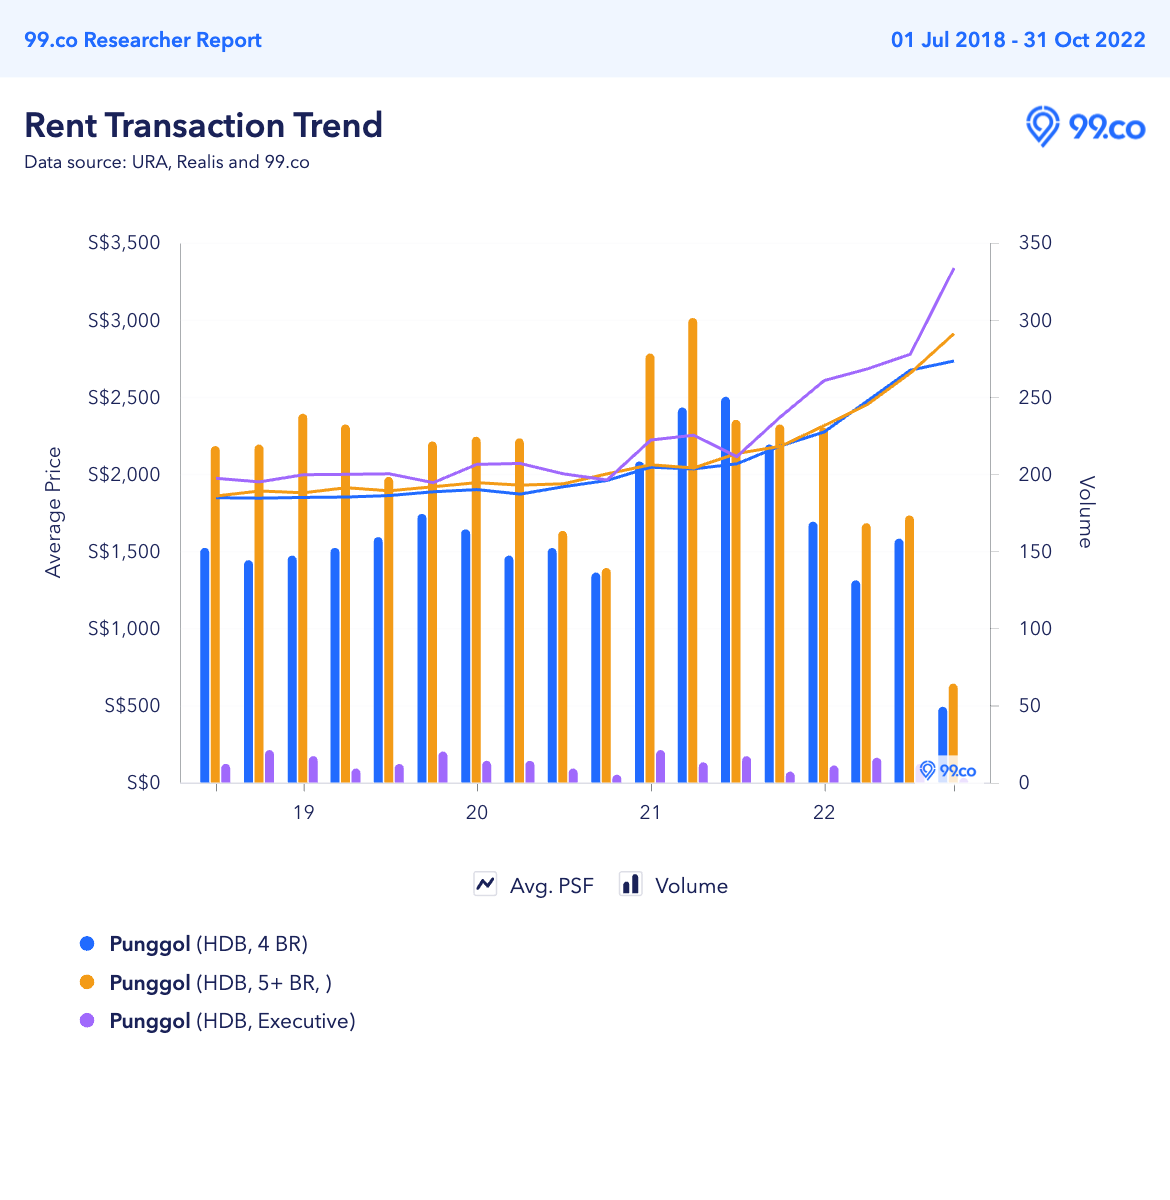
We can see from the chart that while rent transaction volumes for HDB flats in Punggol have decreased since their historical highs in Q1 and Q2 of 2021, average rent prices in the corresponding period have increased.
This is due to lower supply (eg. from locked-in leases), as demand for renting across all flat types went up. The chart also shows consistent demand for larger flat sizes (5-rooms over 4-rooms).
In fact, between Q3 2021 and Q3 2022, 2-, 3-, 4-, 5-room and executive HDB flats in Punggol saw their average rent prices rise by 11.13%, 37.76%, 29.38%, 24.44% and 31.41% respectively.
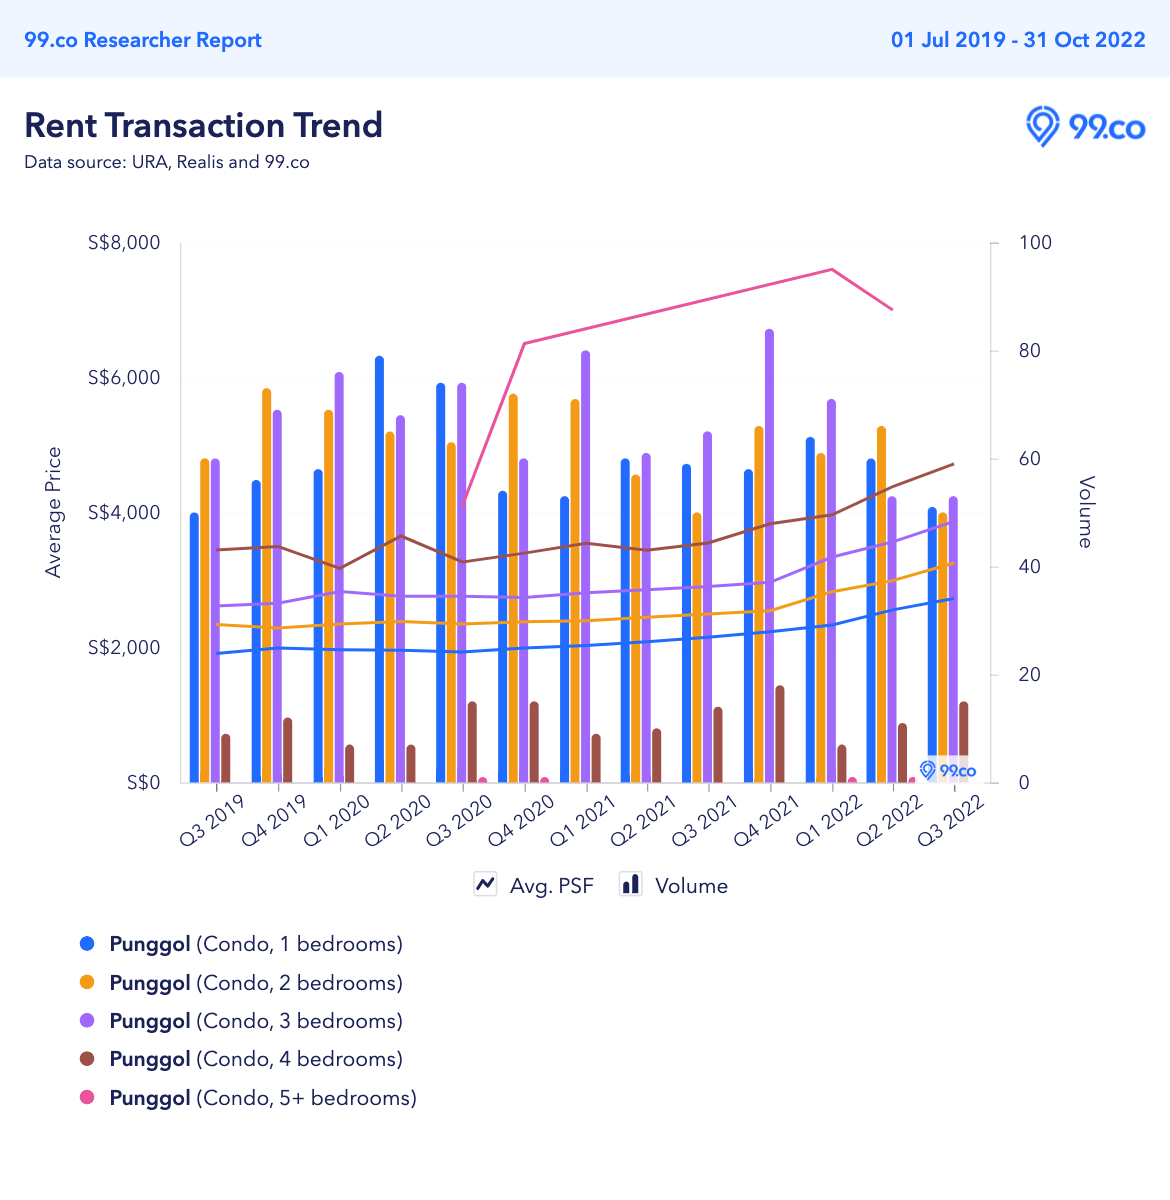
Similarly, for private condos (excluding ECs), the average rental prices for all apartment sizes have increased across the board.
For example, 1-bedroom condo units in Punggol saw an 11.31% increase between Q3 2020 and Q3 2021 but rose 26.70% between Q3 2021 and Q3 2022. These are from Watertown and Parc Centros.
For the 2-, 3- and 4-bedroom apartments, average rental prices rose 30.27%, 33.23% and 33.06%, respectively, over Q3 2021-Q3 2022. These are mostly from A Treasure Trove, Parc Centros, River Isles, Watertown and Flo Residence.
For 5-bedroom+ apartments, as there are only four recorded transactions, prices are far more erratic. Still, there’s a 40% rise between Q3 2020 and Q2 2022. These are from A Treasure Trove and Parc Centros.
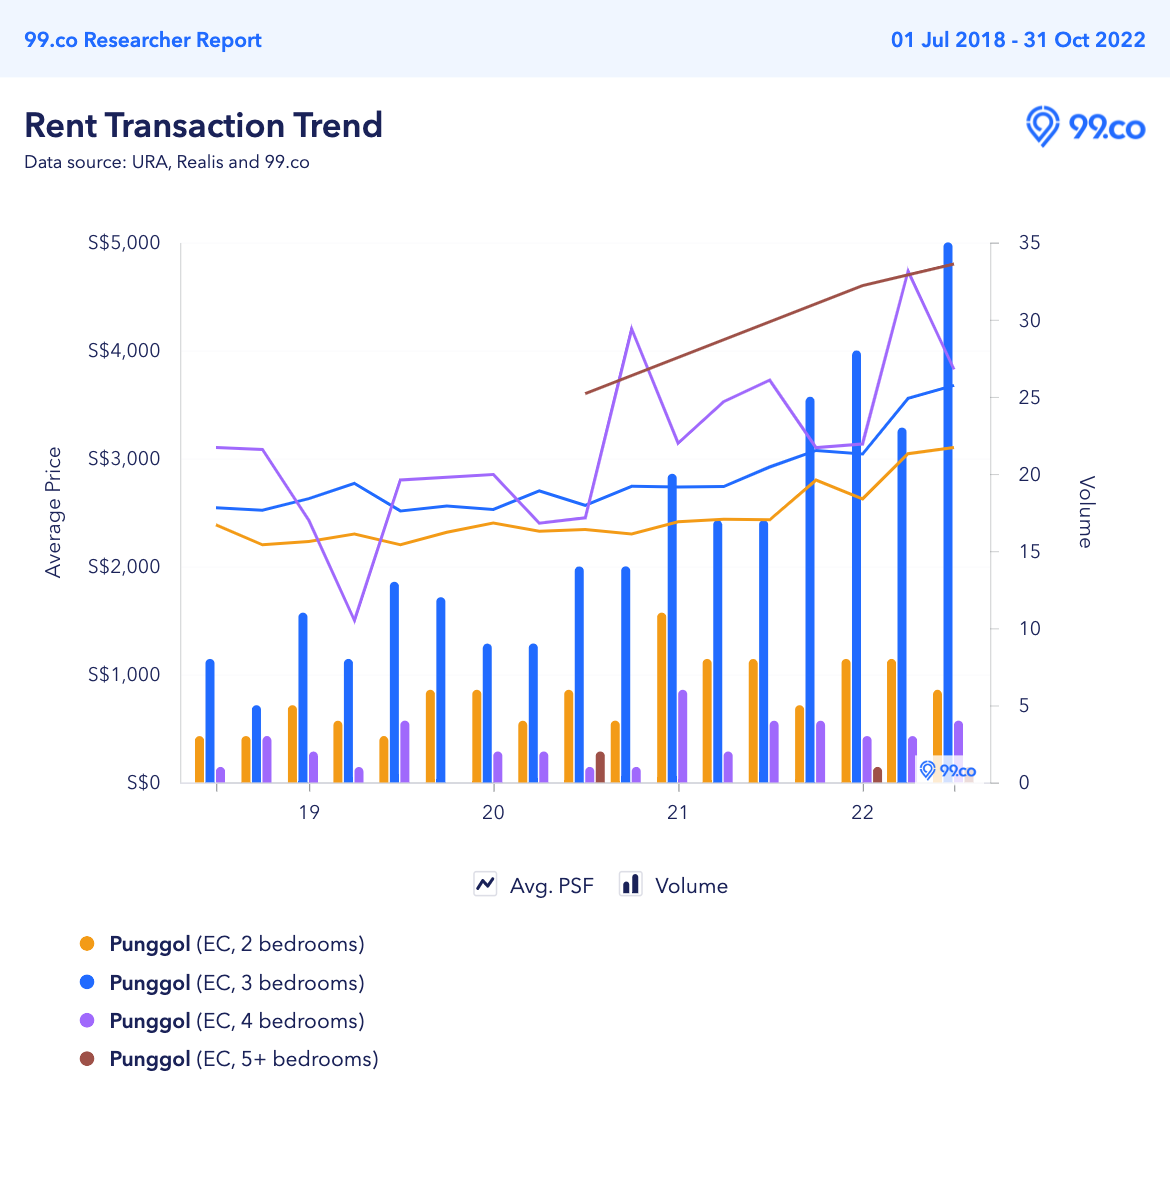 Finally, for executive condominiums (ECs) in Punggol, we see 2- and 3-bedroom EC units commanding higher average rent increases compared to 4-bedroom units over the past year.
Between Q3 2021 and Q3 2022, 2- and 3-bedders saw average rent prices rise 27.51% and 25.86%, respectively – signifying their popularity. Four-bedroom units rose at a much lower 2.68% over the same period, but that’s after some volatility due to lower supply.
What’s notable here is that transaction volumes for 3-bedroom EC units are on the rise, with 35 units rented in Q3 2022 as opposed to about 17 in Q3 2021. This trendline bucks what we’ve seen for HDBs and private condos – where volumes decreased due to short supply.
Most of these supplies are from Prive, Waterbay, Twin Waterfalls, Riverparc Residence, Waterwoods, The Terrace and Ecopolitan.
For 5-bedroom+ units, due to a much lesser supply, average rents surged 33.33% between Q3 2020 and Q3 2022. There were only four rental transactions from Waterbay and Ecopolitan.
Q3 2022 vs 2021: HDB, condo and EC rental transactions in Punggol
| Top Recent (Q3 2022/October 2022) Rental Prices and Transactions in Punggol and Transacted Rents for the same room type in the area 12 months ago | ||||||||
| Room Type | Project(s) | Recent Transaction Date | Monthly Rent (S$) | Project(s) | Transaction Date A Year Ago | Monthly Rent (S$) | S$ Increase between Periods Compared | Percentage Increase |
| 2-room HDB | 222A Sumang Lane | Oct 2022 | 2100 | 209C Punggol Place | August 2021 | 1900 | 200 | 10.53% |
| 3-room HDB | 212A Punggol Walk, 312A Sumang Link | Aug-Oct 2022 | 3200 | 672C Edgefield Plains | July 2021 | 2350 | 850 | 36.17% |
| 4-room HDB | 305D, 619B, 624B Punggol Drive, 668A, 661C Edgedale Plains, 624B Punggol Central | September/ October 2022 | 3700 | 306C Punggol Place | July 2021 | 3000 | 700 | 23.33% |
| 5-room HDB | 171C Edgedale Plains | Oct 2022 | 4000 | 120A Edgedale Plains | Aug 2021 | 3250 | 750 | 23.08% |
| Executive | 117 Edgefield Plains | Oct 2022 | 3900 | 118 Edgefield Plains | July 2021 | 2600 | 1300 | 50.00% |
| 1-bedroom 550-sqft Private Condo | Watertown | Aug 2022 | 3500 | Watertown | August 2021 | 2,700 | 800 | 29.63% |
| 2-bedroom, 950-sqft Private Condo | Watertown | Sept 2022 | 4300 | Watertown | August 2021 | 3,400 | 900 | 26.47% |
| 3-bedroom, 1,250-sqft Private Condo | A Treasure Trove | July 2022 | 5100 | A Treasure Trove | July 2021 | 3,400 | 1,700 | 50.00% |
| 4-bedroom, 1,350-sqft Private Condo | Parc Centros | Sept 2022 | 5800 | Parc Centros | July 2021 | 3550 | 2250 | 63.38% |
| 3-bedroom, 950-sqft EC | Twin Waterfalls | Sept 2022 | 4500 | Twin Waterfalls | Aug 2021 | 2950 | 1550 | 52.54% |
| 4-bedroom, 1,450-sqft EC | Prive | July 2022 | 5000 | Prive | Aug 2021 | 3600 | 1400 | 38.89% |
| 5-bedroom, 1,450-sqft EC | Waterbay | Aug 2022 | 4800 | N/A | N/A | N/A | N/A | N/A |
The chart above gives us a good snapshot of how rental prices for different flat and room types in the Punggol estate have risen over the past year.
For example, a year ago, a 2-room flat in 209C Punggol Place was rented out for S$1,900. Last October, a 2-room HDB flat in 222A Sumang Lane, just 1.5 kilometres away, was recently rented out for S$2,100 per month – a 10.53% rise.
Similarly, a year ago in July, a 3-room flat at 672C Edgefield Plains was rented out for S$2,350. About a year later, two separate 3-room HDB flats – one at 212A Punggol Walk and another at 312A Sumang Link – roughly 2km away – were rented out for S$3,200 each – an S$850 increase, or 36.17% more.
The shocker came from an Executive HDB flat in Edgefield Plains, which saw rent rose by S$1,300 (50%) from S$2,600 a year ago to S$3,900!
This is the same at private condos.
A 3-bedroom 1,250-sqft condo at A Treasure Trove was rented out for S$3,400 one year ago. In July 2022, it went for S$5,100 a month – a 50% increase. Also, a 4-bedroom 1,350-sqft condo at Parc Centros was rented out for S$3,550 in July last year. Last September, a similar unit was rented out for S$5,800 – a whopping S$2,250 increase, or 63.38%!
The story’s the same for ECs. A 3-bedroom, 950-sqft EC unit at Twin Waterfalls was rented out for S$2,950 in August last year. Last September, someone rented a similar unit for S$4,500 – a 52.54% increase.
–
The situation in Punggol across all flat and room types is just a snapshot of how rent in Singapore could get out of hand if not monitored and reigned in quickly.
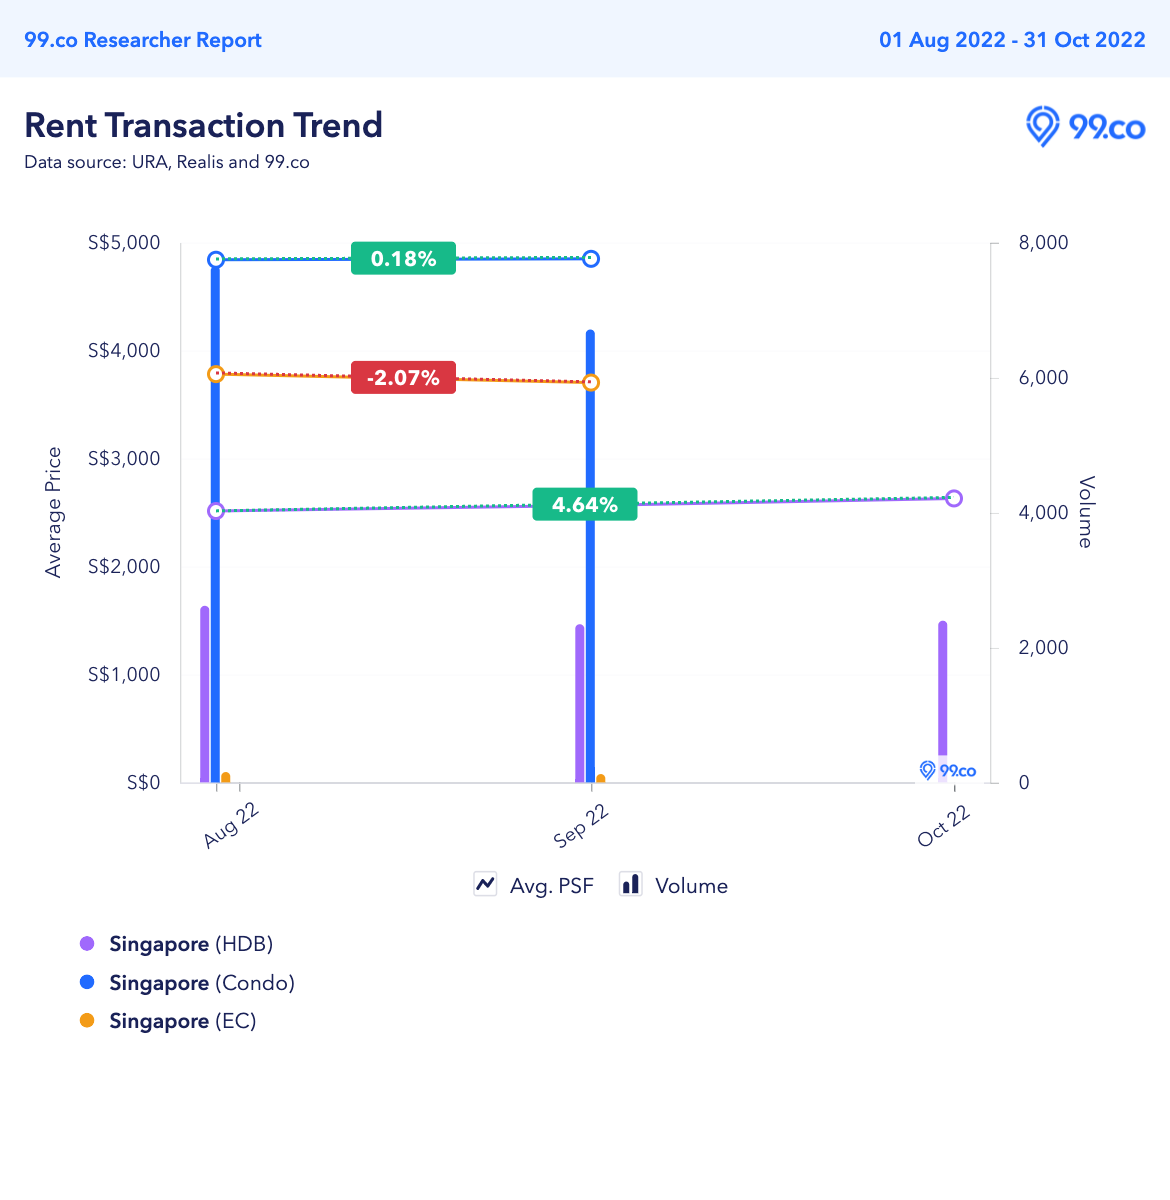
Already, October 2022 rental figures show that average rents for HDB flats have increased by 4.64% since August.
While we’ve yet to capture and finalise rental figures for private condos and ECs in October, we reckon the percentage rise could only go up as the 30 September cooling measures have forced many caught by the restrictions to consider renting.
Good news for landlords – not so good news if you’re a tenant or looking to be one.
–

1
1

3
2

3
3

1
1

3
2

3
2

2
1

3
2

0
1

4
3

3
2

3
2

3
2

3
2

3
2

1
1

1
1

2
2

2
2

3
2

3
2

4
3

3
3

3
2

4
4

3
3

3
1

3
2

3
2

2
2

3
2

3
2

2
2

3
3

4
3

2
2

2
2

3
2

1
1

3
3

2
2

3
2
3
2

4
6
4
3
3
3
3
2
3
3
3
1
3
2
3
2
2
2
3
2
3
2
2
2
3
3
4
3
2
2
3
2
1
1

3
3

1
1

0
1

3
2

3
2

3
3

4
5

3
3

1
1

2
2

3
3

1
1

4
4

2
2

2
2

3
3

4
3

3
5

3
3

2
2
–
The post Rent analysis: Punggol tops list, with 40-41% rise in median rent across HDB flat types since Q3 last year appeared first on .
