
In this edition, we are going to look at When and Where to Focus Your Listings in the month of October – plus a special bonus treat!
While many people are prepping for Halloween, let’s check out to see if our findings are just as spooky!
Speaking of spooky, these past 6 months have been a real whirlwind for real estate professionals in Singapore (actually, around the whole world too).
It all started in April and physical viewings were no longer permitted – our world was topsy-turvy, and experts warned us to expect the worst. But let’s start looking at the historical facts of how our industry weathered this global pandemic in Singapore.
So, your special bonus treat this month is:
Volume Of Agents’ Listings Vs. Volume of Consumers’ Listing Views
Now that we’ve crossed the 6-month mark, let’s look at how much your clients have been interacting with your listings:

From the graph above, we can confirm these facts:
- Client viewings surpass total number of listings by at least 50x
This means your clients are searching and viewing much more than you are posting. - Your clients’ interest maintained steadily over the past 6 months
Contrary to some of our worst fears; your clients actually got more engaged over the Circuit Breaker period! - Real estate agents are still aggressively putting up listings
Despite the odds, agents have been steadily putting up listings for their clients without fail throughout the months. PropertyGuru thanks you for your support!
Don’t lose out to competition – go into AgentNet now to Boost, repost and Spotlight! (Find out information on our Premium Features here.)
So, we’ve just advised you to Boost, repost and Spotlight.
Your next question will be when you should do those things; so that you can enjoy the highest return-of-investment on your Ad Credits!
When to Focus Your Listings?
We want to be honest here – property seekers’ behaviour in September got us really asking questions.
While property seekers are viewing your listings more than before, the distribution during the week has shifted drastically!
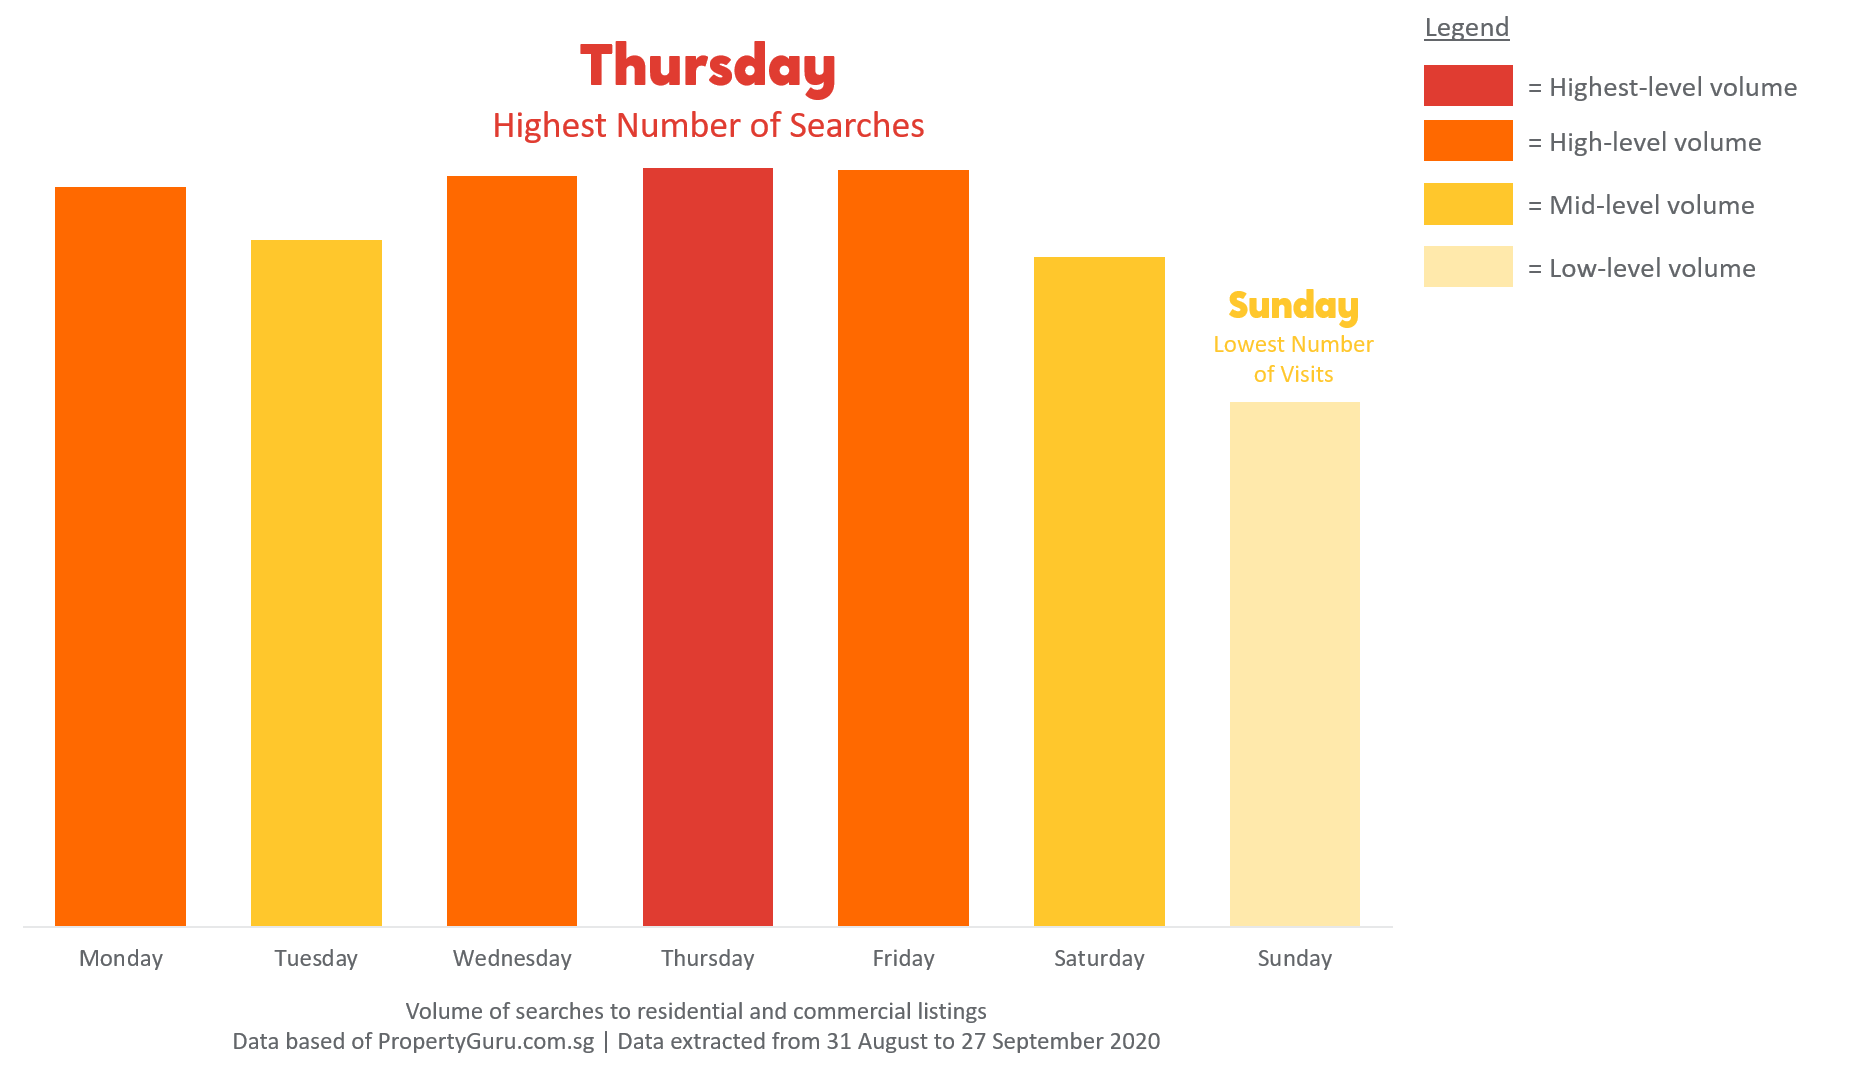
Previously when we looked at August’s data, Tuesday reigned champion – but it dropped significantly and shifted to Thursday this time.
Throughout the past 6 months, property seekers’ behaviour has been changing quite a bit and this is likely attributed to how our daily lives have been changing too.
However if there’s one thing that remains consistent – is that they’re usually most active between Mondays to Thursdays.
Okay, there are actually two things that remain consistent…
Property seekers are still most active between 12PM to 3PM – don’t miss out on targeting them!

But we know with all your viewings and mountains of other to-dos, it can be hard to keep up. Which is why you should utilise Auto-Repost and Auto-Boost!
This way, you just need to focus on closing your sales and let us take care of this for you.
Now you know the best day of the week and time of the day – let’s check out the popularity of the districts.
Where to Focus Your Listings?
Districts 11, 21 seem to have dropped quite a bit in interest – but we need to look at this in relative terms. The actual number of homes and individuals looking for homes in D11, 21 are definitely lower than most other parts of Singapore; therefore even though it looks low in comparison, it shouldn’t be a cause to worry.
Interestingly, D19-20 shot up in popularity over September!

We hope you found this issue as insightful (or even more insightful) as all the previous ones! Stay tuned for the next one in November.
In the meantime, continue staying safe!
– PropertyGuru Team
