
Hello to all our fabulous Agent Partners in Singapore! It’s time again for another update on When and Where to Focus Your Listings.
The COVID-19 situation in Singapore looks to be promising (let’s keep our fingers crossed) and there’s buzz going around about Phase 3! Don’t forget to claim your TraceTogether token by the end of the year, though.
So, with things steadily looking up, let’s see if our findings are the same!
Psst, you’ll also notice that this edition has received some upgrades. If you have any feedback or ideas on how we can better improve this monthly article for you, we’d love to hear from you!
When to Focus Your Listings
In contrast to our October edition, it looks like consumers’ behaviour is slowly shifting away from weekdays. You’ll notice the consumer picks up traction on Saturday, then peaks over Sunday to Monday and starts tapering off Tuesday onwards.
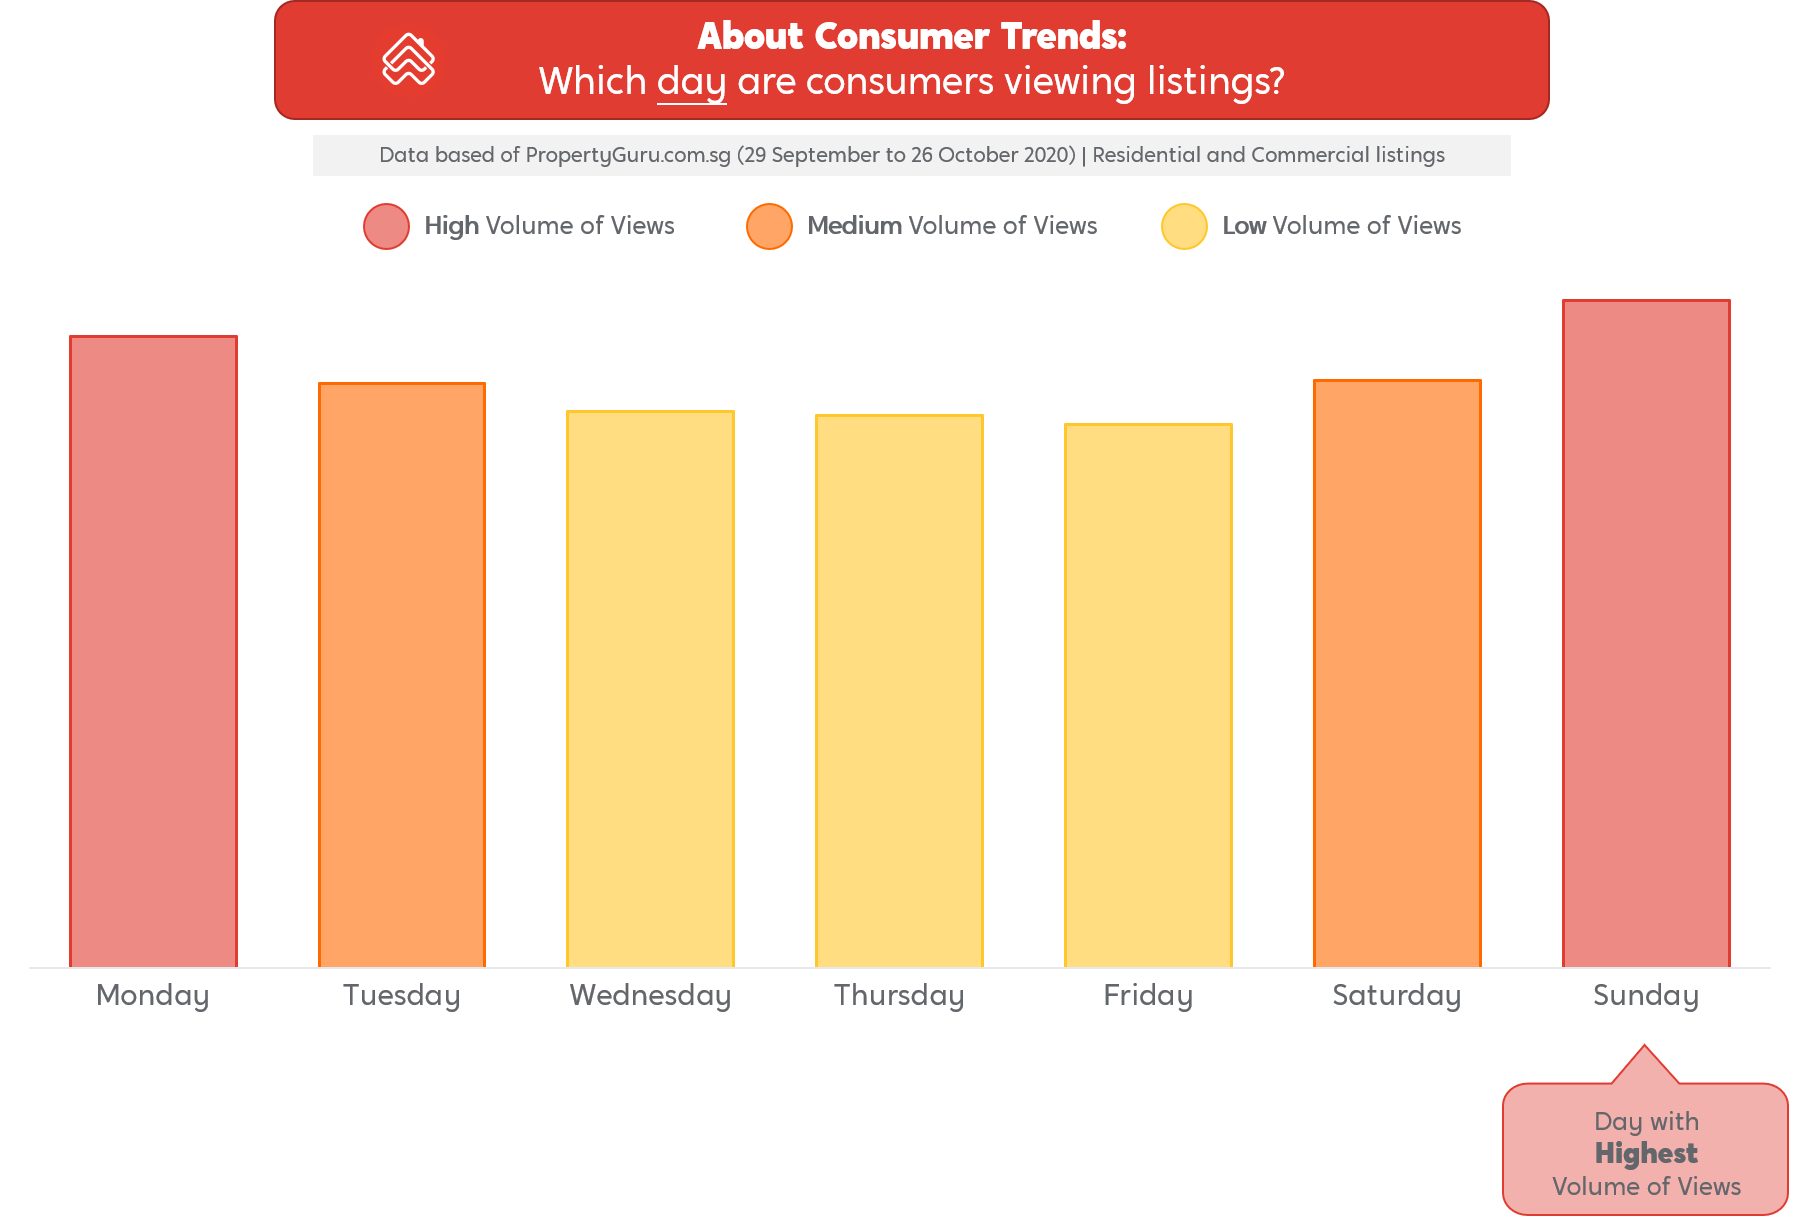
We think this could be due to more and more offices reopening again, and your consumers’ daily lifestyles are shifting (yet again). Alongside, children being back in school is likely a huge influence too.
I have a personal hunch on why Sunday has the highest volume of views!
Now families are able to gather more; means grandchildren can be taken care of by grandparents on weekends; means parents have more ‘free time’ to browse for property. What do you think?
Nothing much has changed with the time your clients are browsing for property. It’s good to see they’re not-so-active between 12AM-7AM; indicating a healthier lifestyle!
Then you can see the traffic picks up at 8AM onwards, then peaks between 12PM-3PM, and continues steadily till 11PM.

Where to Focus Your Listings
This section is where you should really be experiencing an upgrade to the article! We’re no longer content with just showing you which districts have the highest search volumes; you deserve to know more than that.
But first, let’s look at things from a macro point-of-view. Serangoon/Thomson (D19-20) continue to be very popular amongst property seekers, with City & South West (D01-08) also maintaining its appeal.

Now let’s zoom in a little bit more! Here’s a look at the district clusters and the respective volume of searches, with their volume of listings for comparison.

No doubt, Serangoon/Thomson (D19-20) and City & South West (D01-08) win the popularity contest – but they also have relatively higher number of listings catering to their demand.
Now, dear Agent Partner, the real question is – where is the market gap?
By answering this, you’ll know exactly where there’s a higher demand versus supply; therefore, you’ll have a higher chance of getting leads and closing a sale!
After doing the math, here’s a look at how much more views the districts have, versus their listings.
The good news is all districts currently have significantly more demand than supply.
However, if you want to look at the one with the most ‘unmet demand’, North (D25-28) is the winner – with close to 8 times more views than there are listings!
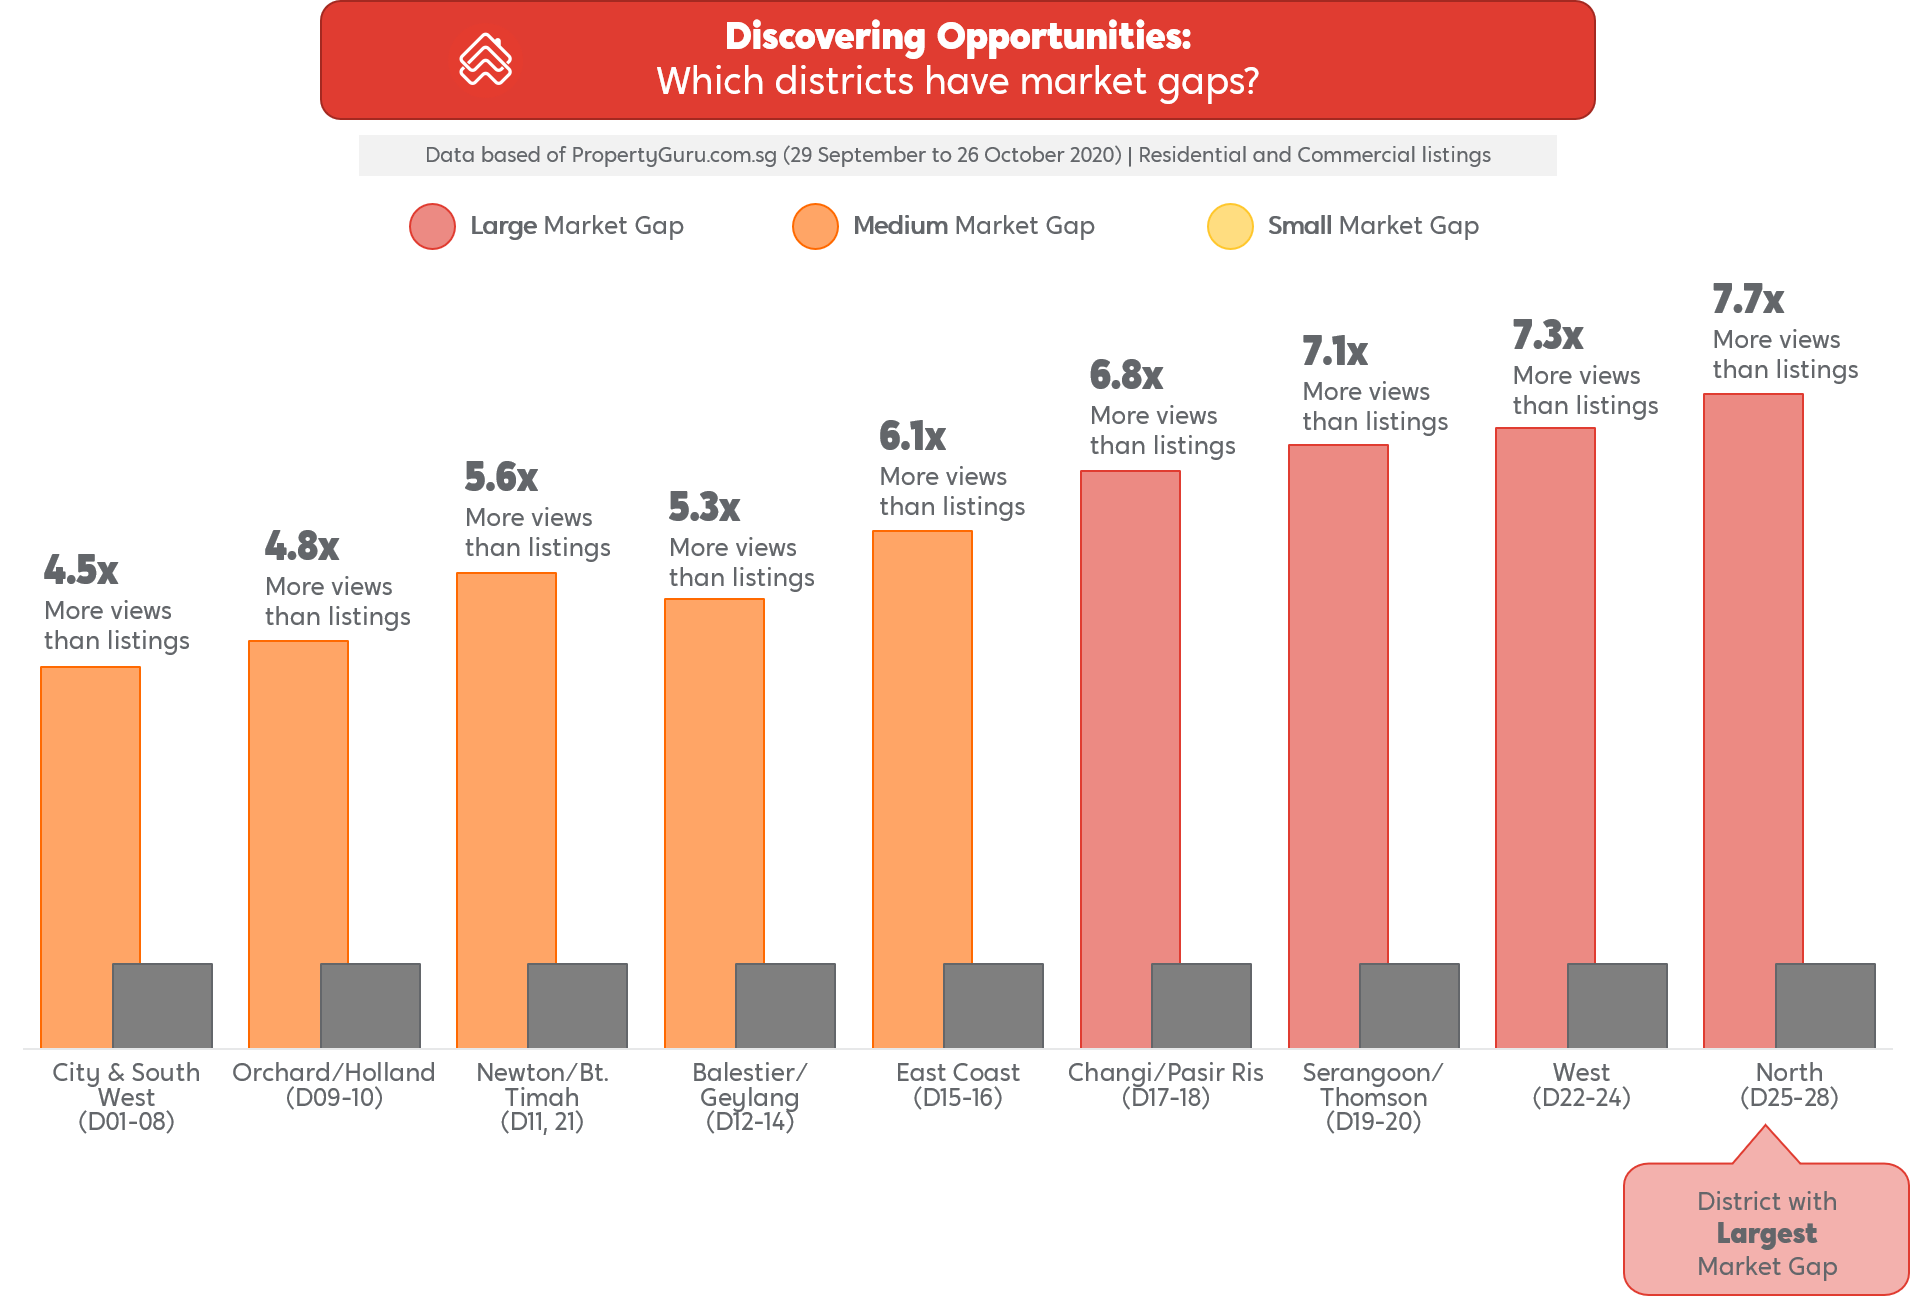
But that doesn’t mean you shouldn’t look at the other district clusters, though! As we called out earlier, all the districts have significant demand and have property seekers waiting for you to open doors to their next property purchase.
That’s a wrap for this month’s edition – we really hope you found these upgrades to the article useful! If you have any feedback or more ideas on how we can improve this monthly article for you, please reach out.
In the meantime, continue staying safe while you go about your work and we’ll catch you at our next article!
Being a better partner for you,
PropertyGuru Team.
